Why MATIC price is setting the scene for a blowout
- Polygon price is consolidating above the $0.62 support hold.
- MATIC price is set to pop higher on the tailwind from equities rallying this morning.
- With dust settling in Asia and a calmer period just around the corner, MATIC price should rally back above $1.00.

Polygon (MATIC) price has had difficulty finding a supportive floor for bulls to get a foot in the door and price action moving higher. Now, however, a floor looks to have been identified at $0.62, with price action consolidating just above. This shows sellers are being met with plenty of buyers as the price is slowly trading sideways. Very silently price broke through the red descending trend line, opening the way for MATIC price to rally up towards $1.18, where it faces a triple cap to the upside.
MATIC is set to kick in the summer season with 75% gains forecasted
Polygon price had a rough few trading weeks, but discreetly that downtrend has now come to a halt as the dollar is taking a backwards step. The support floor identified at $0.62 is holding firm, and buyers are meeting sellers with ease, reflected in the Relative Strength Index (RSI), which is slowly trading away from oversold. With the added factor that equity markets are starting to book more days of gains, a gentle tailwind appears to be underpinning MATIC’s price action and pushing it higher.
MATIC price is first set to rally up to around the monthly S1 support level at $0.80, which was vital as support on May 09 and May 10. At that point it will likely meet some resistance before moving towards $0.96 and possibly $1.06, as the $1 big figure acts like a price magnet. Once through there, it will be very tricky for bulls to sit on their hands and refrain from taking profit as a triple cap looms (SMA) at $1.80 and $1.87, with the 55-day Simple Moving Average and a double pivotal historic level. Those levels are likely to trigger some profit-taking for sure.
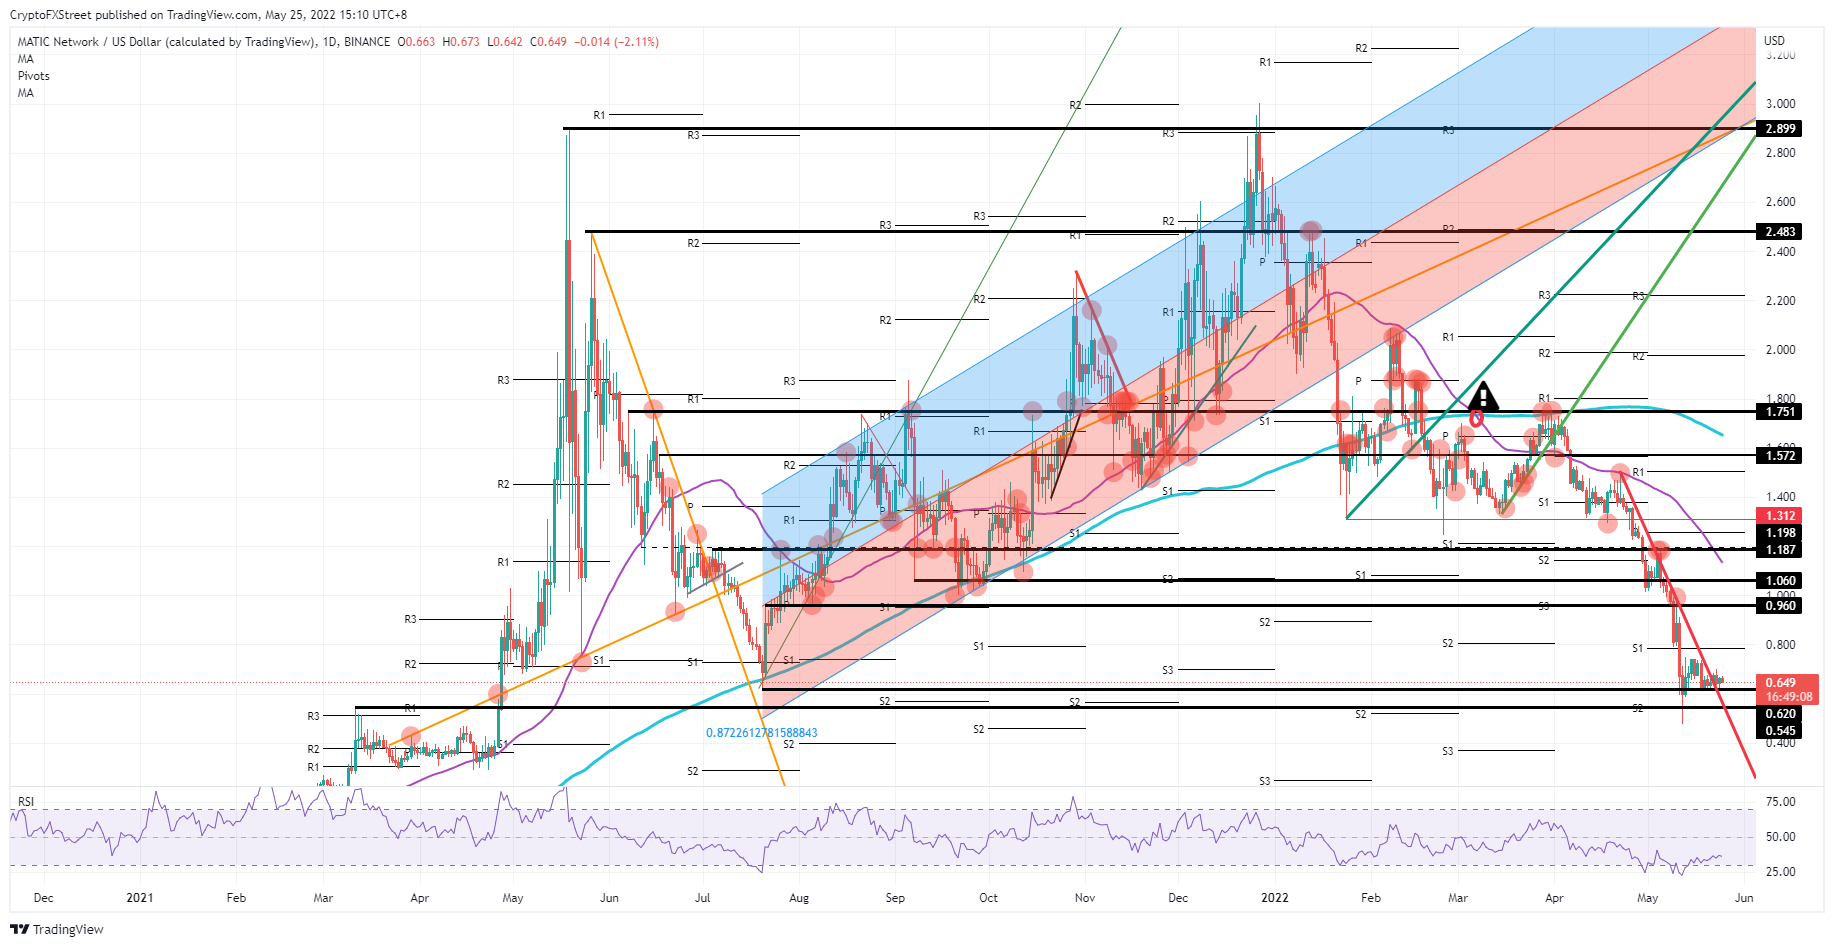
MATIC/USD daily chart
On the other hand, buyers could be met with another washout if price action breaks down and the market becomes overweight with sellers. Such a cramp in markets could come from a negative headline that sidelines market participants. A good example is the relaunching of several ballistic missiles out of North Korea, where if one were to hit South Korea, it would tremble the world stage and add to the already existing geopolitical weight of uncertainty. Matic price would then quickly see investors fold, and price action drop further towards $0.40.
Author

Filip Lagaart
FXStreet
Filip Lagaart is a former sales/trader with over 15 years of financial markets expertise under its belt.



