- Algorand price shows rejection from a critical barrier, which could entice a sweep of 2020 liquidity levels.
- ALGO shows an uptick in large transactions, which has resulted in significant selloffs this year.
- A flip of the 8-day exponential moving average into support could invalidate the bearish stronghold
Algorand price continues to pack on negative returns for November. As the final days of the month approach, knife-catching bulls are skimming through all digital assets looking for a last-minute opportunity. Unfortunately, the ALGO price may not be a top pick to bounce anytime soon, as the technicals show confounding evidence of bearish control.
Algorand price looks problematic
Algorand price has endured a 47% decline since the beginning of the month. As the selloff progresses, the price action has become congested near $0.20 as the bulls and bears grappled over a week over a trading range.
On November 23, the bulls printed a morning star pattern, signalling for sidelined bulls to enter the market. Classical price action traders likely placed their stop under the monthly low at $0.225 in hopes of a retaliation rally against the bearish onslaught.
On November 27, the bulls bolstered their first attempt at reconquering the 8-day exponential moving average (EMA), but unfortunately, the price was rejected and had been trading beneath the indicator ever since.
Algorand price currently auctions at $0.233 and has yet to invalidate the bullish signal. However, on-chain metrics hint that the move south could be coming soon. According to Into-the-Blocks' Large Transactions by Volume Indicator,
The indicator had a similar reading on August 15 and September 23 at $375.8 and $297.4 million. Interestingly enough, the Algorsand price fell by 23% and 27% in less than a week after indicators’ influx spikes were displayed.
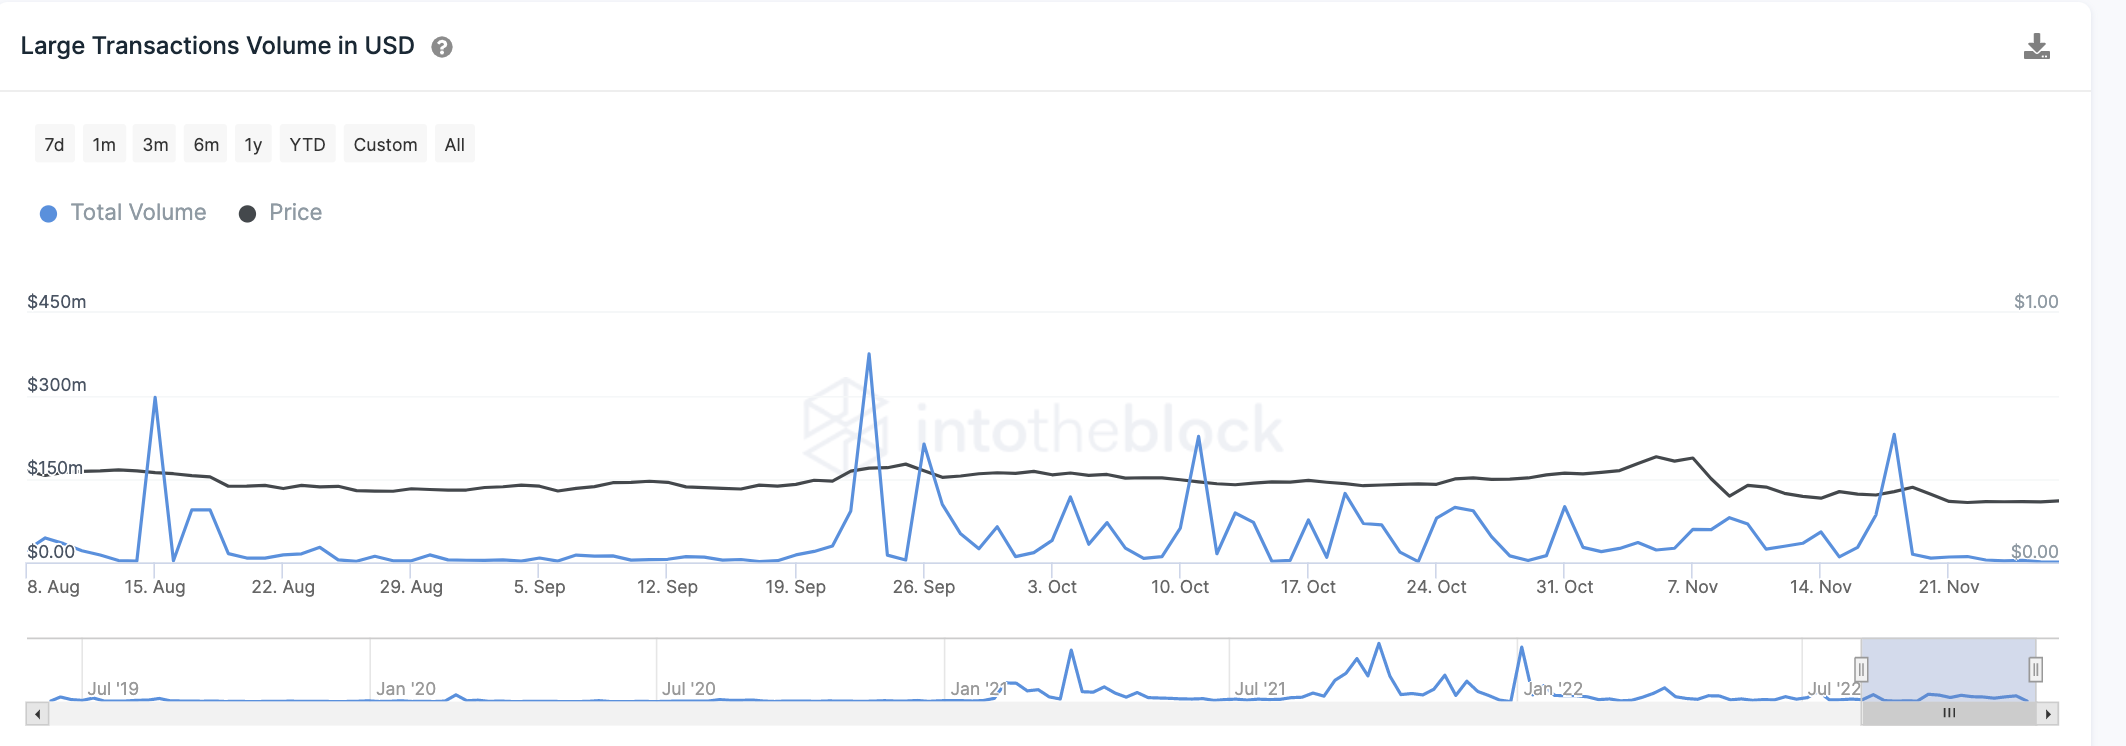
IntotheBlock's Large Transactions Indicator
Algorand price is already down 20% since the indicator's reading but can continue to fall as the rejection of the 8-day EMA could provoke the breach of the newfound monthly low at $0.237. A breach of the low would likely promote further downtrend price action targeting the 2020 liquidity at $0.224 for an additional 8% dip in market value.
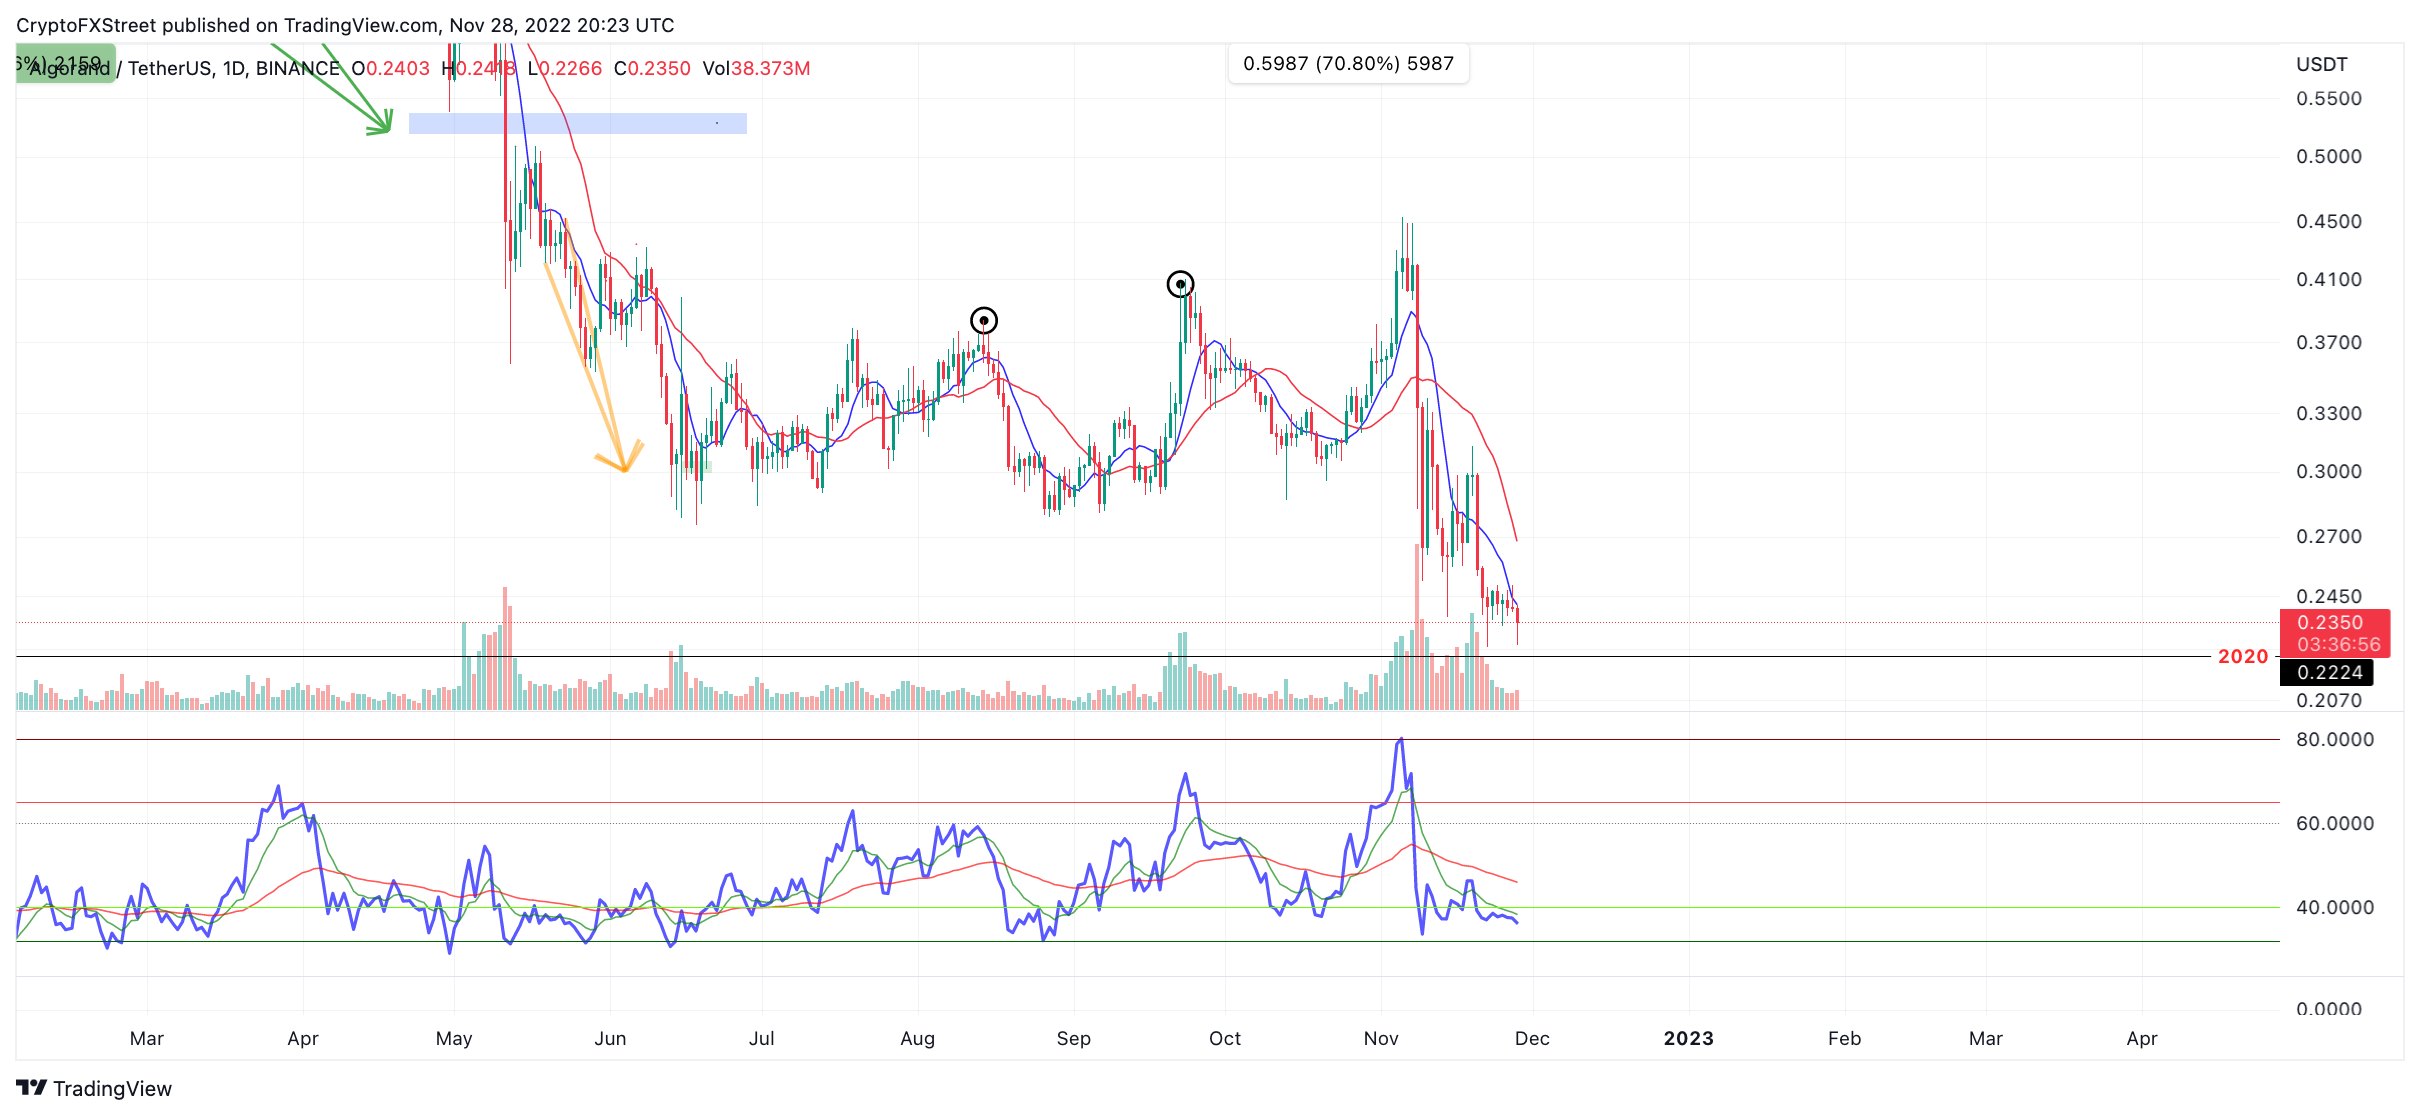
ALGO/USDT 1-day chart
The bulls will need to conquer the 8-day EMA to secure the confidence amongst bulls and invalidate the bearish thesis. A breach above the moving average could promote a rally towards the 21-day simple moving average of $0.270, resulting in a 17% increase from the current Algorand price.
Here's how Bitcoin price moves could affect Algorand price
Information on these pages contains forward-looking statements that involve risks and uncertainties. Markets and instruments profiled on this page are for informational purposes only and should not in any way come across as a recommendation to buy or sell in these assets. You should do your own thorough research before making any investment decisions. FXStreet does not in any way guarantee that this information is free from mistakes, errors, or material misstatements. It also does not guarantee that this information is of a timely nature. Investing in Open Markets involves a great deal of risk, including the loss of all or a portion of your investment, as well as emotional distress. All risks, losses and costs associated with investing, including total loss of principal, are your responsibility. The views and opinions expressed in this article are those of the authors and do not necessarily reflect the official policy or position of FXStreet nor its advertisers. The author will not be held responsible for information that is found at the end of links posted on this page.
If not otherwise explicitly mentioned in the body of the article, at the time of writing, the author has no position in any stock mentioned in this article and no business relationship with any company mentioned. The author has not received compensation for writing this article, other than from FXStreet.
FXStreet and the author do not provide personalized recommendations. The author makes no representations as to the accuracy, completeness, or suitability of this information. FXStreet and the author will not be liable for any errors, omissions or any losses, injuries or damages arising from this information and its display or use. Errors and omissions excepted.
The author and FXStreet are not registered investment advisors and nothing in this article is intended to be investment advice.
Recommended Content
Editors’ Picks
XRP price extends losses on Tuesday, risks decline below support at $0.60
XRP price dropped closer to its psychologically important support level at $0.60 on Tuesday amidst a steep correction in the crypto ecosystem. Most of the top 30 cryptocurrencies by market capitalization have noted a decline in their prices on March 19.
Avalanche price could rise 20% on gaming narrative ahead of GDC conference
Avalanche is an outlier on Monday, rallying while the broader market crashes. It has outperformed Bitcoin price, as well as meme and AI crypto coins, sectors that have been thriving of late. AVAX’s good fortune comes ahead of the Game Developers Conference.
Bitcoin price shows weakness, but new BTC whales have created solid support at $56,400
Bitcoin downside momentum strengthens, giving sidelined and late bulls a chance to buy the dip. The market remains focussed on the oncoming halving, expected to kick off the next bull cycle.
Crypto AI token rally persists, ignited by NVIDIA AI conference
NVIDIA AI conference, starting on Monday, is considered a key AI event as market participants await the unveiling of the next AI chip, B100. NVIDIA’s influence extends to the mining sector in crypto as its chips are focused on high-performance GPUs.
Bitcoin: Can BTC hit $100,000 without a correction?
Bitcoin (BTC) price shows a slowdown in momentum as it set up a new all-time high of $73,949 on March 13. Considering the massive uptrend that BTC has been experiencing, a short-term correction is nothing to be concerned about.