VeChain Price Prediction: VET death cross writes a bearish outlook
- VeChain price complicated by resistance at key moving averages as death cross emerges.
- Emergence at the apex of the ascending triangle marginalizes the pattern to generate substantial returns.
- A decline below $0.119 will confirm the breakout failure on the twelve-hour chart.

VeChain price rests at a major inflection point on the twelve-hour chart, complicated by the notable resistance defined by the intersection of two important moving averages and the recently triggered death cross. A close above $0.152 renews a bullish interpretation of the fledgling breakout.
VeChain price seeks strength, instead met with distribution
VeChain price tumbled 80% from the April high to the May low, logging its worst weekly decline since 2018 and placing it among the most significant losses in the cryptocurrency complex in May.
VET countered the tremendous decline with a sizeable 220% rebound from the May 19 low into the May 20 high. From May 21 to June 2, VeChain price composed an ascending triangle pattern that triggered on June 3 with a marginal break above the triangle’s supply line (upper).
However, VeChain price followed the breakout with a 12% reversal and a bearish outside bar on the twelve-hour chart, signaling distribution. The setback occurred just above the intersection of the 50 twelve-hour simple moving average at $0.138 and the 61.8% Fibonacci retracement of the May correction at $0.140.
The breakout potential was also depressed because VET resolved the pattern at the apex of the triangle. Based on historical precedent, breakouts at or near the apex detract from the vigor of the advance and increase the probabilities of it failing.
The measured move of the pattern is 67% from the triangle’s upper trend line at $0.140, setting VeChain price on course to rally near the May at $0.250.
VeChain price is clearly at an inflection point on the twelve-hour chart for the eventual resolution of the triangle and for the larger rally from the May 19 low, particularly in light of the activation of a death cross. A death cross occurs when the fast-moving average (50 twelve-hour SMA) crosses below the slow-moving average (200 twelve-hour SMA).
VET needs a twelve-hour close above $0.152 to confirm the breakout that may strike a quick advance to the 78.6% retracement at $0.189.
A successful breakout above the 78.6% retracement level leaves VET poised to reach the measured move target of $0.234.
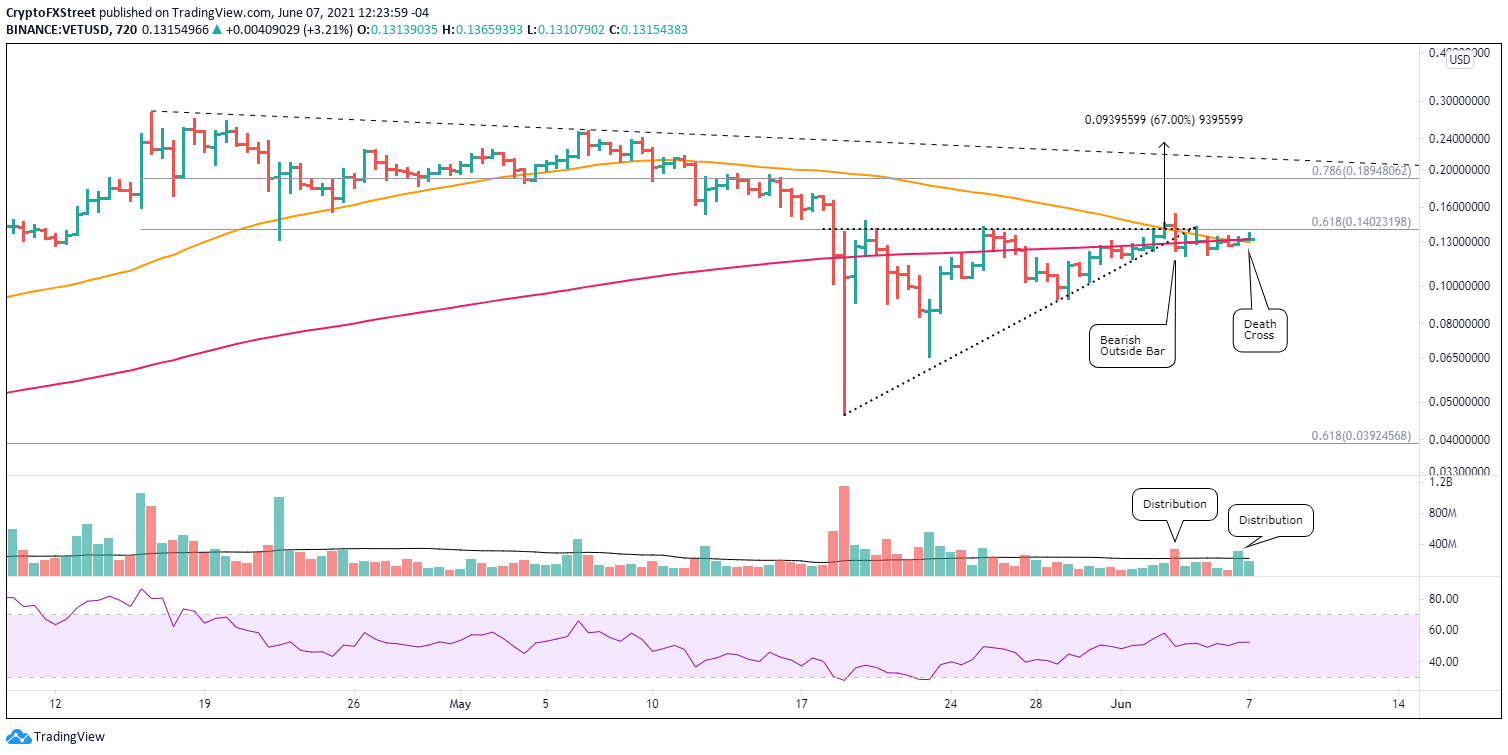
VET/USD 12-hour chart
If VeChain price falls below $0.119, market operators should pivot their trading direction to the short side. A decline below $0.092 will confirm the bearish narrative.
The confluence of a death cross, a significant Fibonacci retracement level and a bearish engulfing bar on the breakout has shifted VET into a sideways drift. Nevertheless, investors should not be surprised or ill-prepared if VeChain price turns down with momentum moving forward.
Author

Sheldon McIntyre, CMT
Independent Analyst
Sheldon has 24 years of investment experience holding various positions in companies based in the United States and Chile. His core competencies include BRIC and G-10 equity markets, swing and position trading and technical analysis.


