• VeChain price action consolidating between the $0.025 and $0.018 levels has led to the formation of a descending wedge pattern.
  • VET could rally 30% because of this bullish technical formation with several indicators to back the theory.
  • A decisive daily candlestick close below the $0.018 support level could invalidate the bullish thesis.

VeChain (VET) price has been overly volatile since the year began, recording massive uptrends before the bearish effort canceled all the ground covered, and vice versa. The instability came as the crypto industry navigated a bear market and macroeconomic data in the US. Bitcoin (BTC) led the way in suffering the brute of all these fundamentals, and the rest of the altcoins suffered by correlation, citing Bitcoin dominance.

Also Read: Top 3 Price Prediction Bitcoin, Ethereum, Ripple: Dark clouds abound for BTC, XRP takes new focus

VeChain price readies for a 30% upswing

VeChain (VET) price has been posting a series of lower lows and lower highs since February 20, which led to the formation of a falling wedge pattern.

A falling wedge pattern occurs when the price bounces between two downward-sloping, converging trendlines and signals a downtrend's end and an uptrend's beginning. Considered a bullish chart formation, a falling wedge pattern can indicate both reversal and continuation patterns – depending on where it appears in the trend.

In VET's case, if bulls defend the support at $0.0188, VeChain price would have a chance to push through the upper trend line, thus affirming a bullish trend reversal. With that, new buy orders may be entered around the 200-, 50-, and 100-day Exponential Moving Averages (EMA) at $0.021, $0.022, and $0.023, respectively, although the uptrend's confirmation may wait until VET flies above the falling wedge pattern.

The most likely target is the $0.025 seller congestion level, which would denote a 30% upswing from the current level.

The Parabolic SAR supports this bullish outlook after it flipped below VeChain price on May 14. When this trend-following indicator tracks an asset from below, it is interpreted as a bullish sign.

Further, the Awesome Oscillators were bullish, soaked in green, and moving toward the mean line to show buyers were gaining ground.

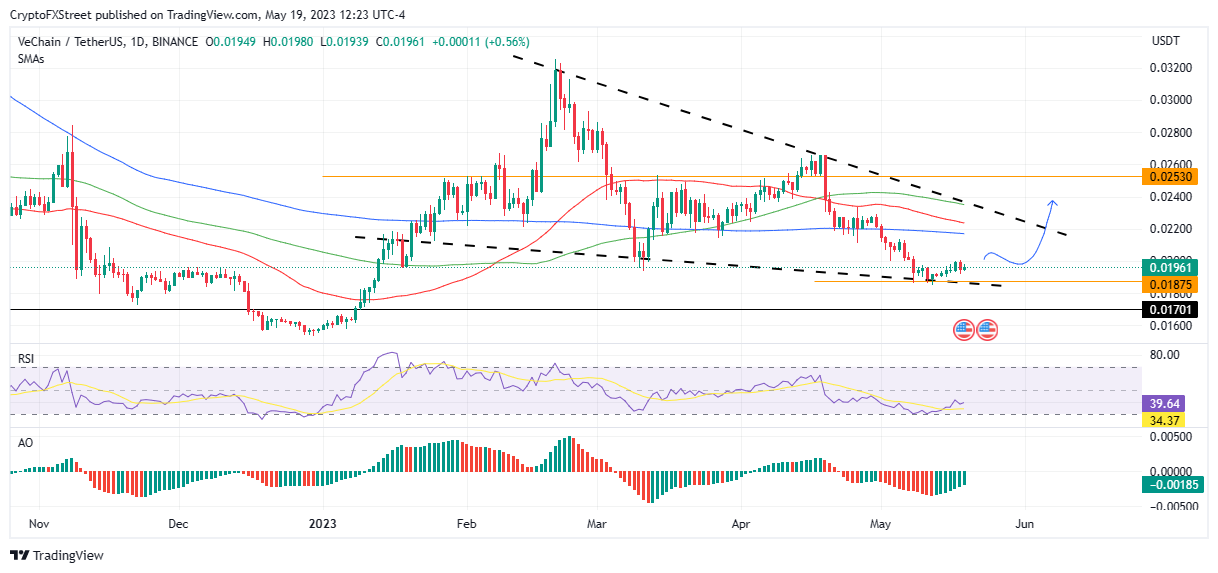
VET/USDT 1-Day Chart

Nevertheless, traders need to exercise caution as VET could drop below the support confluence between the horizontal line and the lower boundary of the wedge at $0.018. The ensuing downtrend could continue until bulls garner enough liquidity to sustain an uptrend.   


Information on these pages contains forward-looking statements that involve risks and uncertainties. Markets and instruments profiled on this page are for informational purposes only and should not in any way come across as a recommendation to buy or sell in these assets. You should do your own thorough research before making any investment decisions. FXStreet does not in any way guarantee that this information is free from mistakes, errors, or material misstatements. It also does not guarantee that this information is of a timely nature. Investing in Open Markets involves a great deal of risk, including the loss of all or a portion of your investment, as well as emotional distress. All risks, losses and costs associated with investing, including total loss of principal, are your responsibility. The views and opinions expressed in this article are those of the authors and do not necessarily reflect the official policy or position of FXStreet nor its advertisers. The author will not be held responsible for information that is found at the end of links posted on this page.

If not otherwise explicitly mentioned in the body of the article, at the time of writing, the author has no position in any stock mentioned in this article and no business relationship with any company mentioned. The author has not received compensation for writing this article, other than from FXStreet.

FXStreet and the author do not provide personalized recommendations. The author makes no representations as to the accuracy, completeness, or suitability of this information. FXStreet and the author will not be liable for any errors, omissions or any losses, injuries or damages arising from this information and its display or use. Errors and omissions excepted.

The author and FXStreet are not registered investment advisors and nothing in this article is intended to be investment advice.

Join Telegram

Recommended content


Recommended Content

Editors’ Picks

Crypto traders brace for short-term volatility with $2.4 billion options expiry on Friday

Crypto traders brace for short-term volatility with $2.4 billion options expiry on Friday

Bitcoin and Ethereum options market looks bullish on Friday, according to data from intelligence tracker Greeks.live. The firm said it has identified two Bitcoin calls that show an underlying bullish sentiment among market participants. 

More Cryptocurrencies News

XRP recovers from week-long decline following Ripple’s response to SEC motion

XRP recovers from week-long decline following Ripple’s response to SEC motion

Ripple filed a letter to the court to support its April 22 motion to strike new expert materials. The legal clash concerns whether SEC accountant Andrea Fox's testimony should be treated as a summary or expert witness. 

More Ripple News

Lido adds 4% gains as protocol rolls out first step towards decentralization

Lido adds 4% gains as protocol rolls out first step towards decentralization

Lido takes the first batch of simple DVT validators to live, a step taken to decentralize the protocol. Lido leveraged technology to expand the protocol to multiple node operators, inviting both solo and community stakers. 

More Lido News

Bitcoin Weekly Forecast: Should you buy BTC here? Premium

Bitcoin Weekly Forecast: Should you buy BTC here?

Bitcoin (BTC) price shows signs of a potential reversal but lacks confirmation, which has divided the investor community into two – those who are buying the dips and those who are expecting a further correction.

More Bitcoin News

Bitcoin: Should you buy BTC here? Premium

Bitcoin: Should you buy BTC here?

Bitcoin (BTC) price shows signs of a potential reversal but lacks confirmation, which has divided the investor community into two – those who are buying the dips and those who are expecting a further correction.

Read full analysis

BTC

ETH

XRP