|

Uniswap price moves according to plan as bullish triangle forecasts 5% uptick

  • Uniswap price recovers from a brief uptick and rejection as the end result on Thursday.
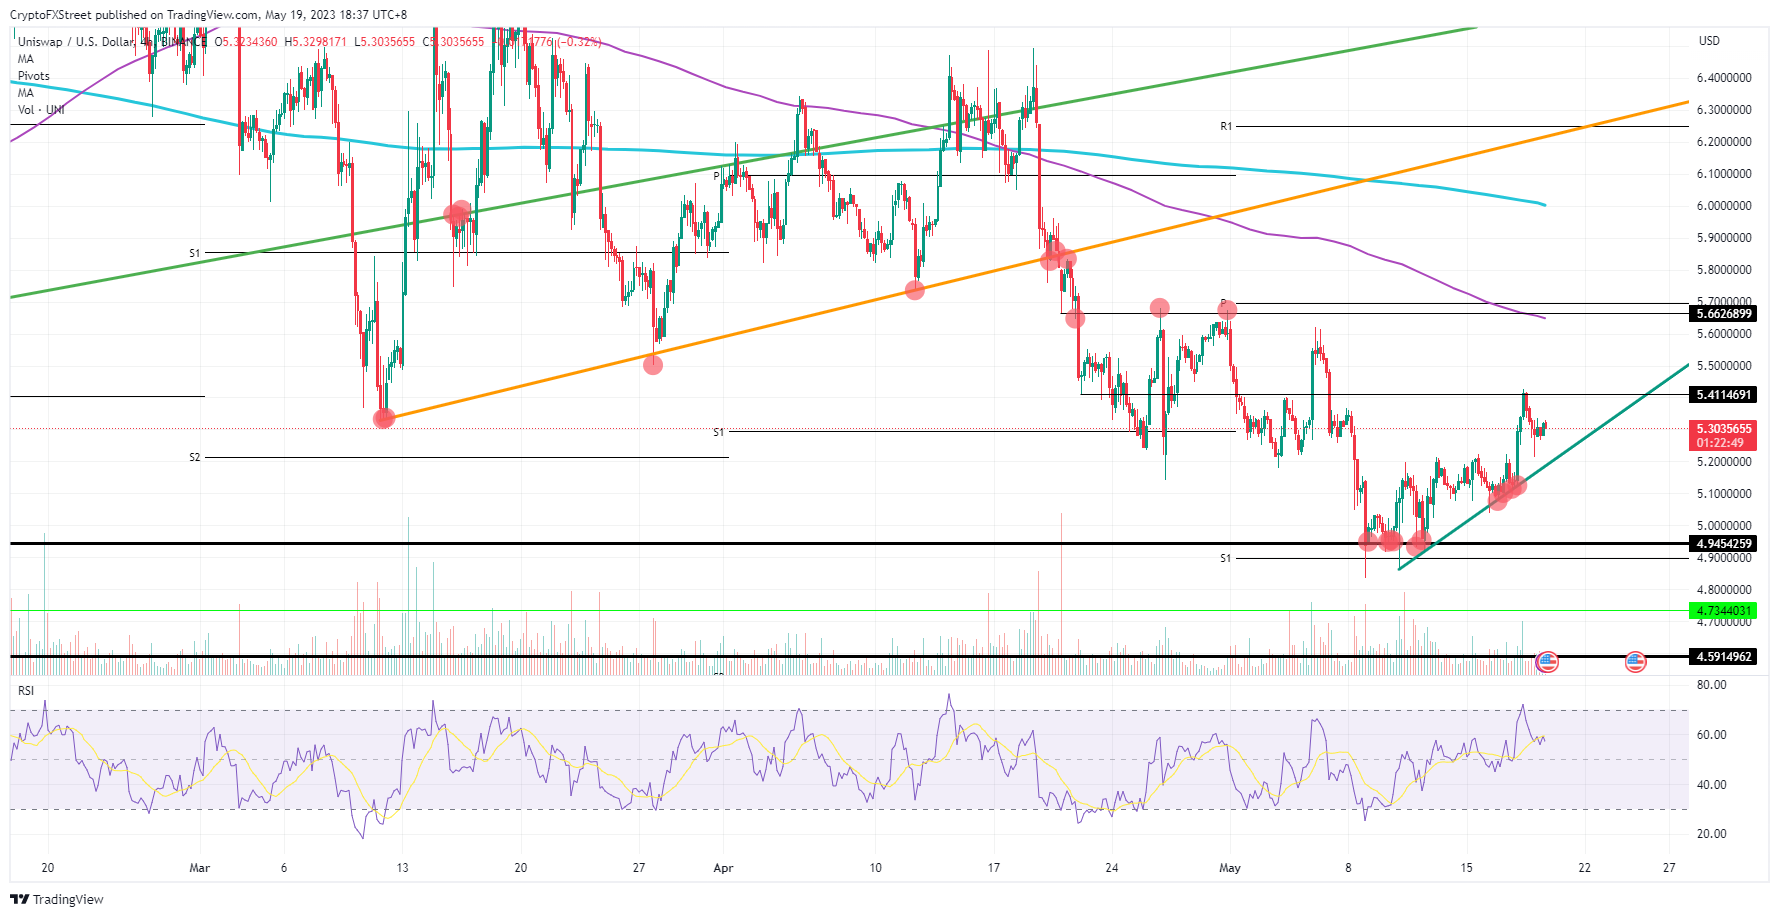
  • UNI identifies a bullish triangle with $5.41 as a base.
  • Expect a nice 5% return once bulls break out of the triangle and head to $5.70.

Uniswap (UNI) price is a bit of an outlier in terms of patterns against its competitors. Where, for example, Cronos is not showing any tangible signs of a rally, UNI is defining a nice bullish triangle that could bring at least a 5% gain alongside it. With great respect for the ascending trendline, bulls know what to do in order to scoop up those profits.

Uniswap price in a textbook scenario that even children can trade

Uniswap price is primed for some upside potential as UNI shows a clear path higher. Not only is the price action chart showing an important bullish triangle, but the Relative Strength Index (RSI) is confirming that pattern as well. After a test at the topside near $5.41, both the price action and the RSI cooled down without retreating too much.

UNI will see support at the ascending triangle with bulls ready to flock in again for a long position. The next test could be the right one to trigger a break to the upside. Once the breakout is triggered, a firm leg higher to $5.70 would bear another 5% gain for traders to book against the 55-day Simple Moving Average (SMA) as a target. 
UNI/USD  4H-chart    

UNI/USD  4H-chart    

Any break of the green ascending trendline would snap that rally and could see it fall substantially lower. That makes sense with the RSI elevated and thus offering more room to the downside with long positions being unwound. It is not impossible to think that UNI could print back below $5, maybe at $4.95, before it finds ample support to halt the correction.

Author

Filip Lagaart

Filip Lagaart is a former sales/trader with over 15 years of financial markets expertise under its belt.

More from Filip Lagaart
Share:

Editor's Picks

XRP slides amid a fragile crypto market structure
Ripple (XRP) falls for the second straight day, trading at $1.37 on Thursday. The broader cryptocurrency market remains fragile as investors weigh the impact of geopolitical tensions in the Middle East, which triggered persistent increases in Crude Oil prices while restricting shipping through the Straight of Hormuz and the Red Sea.
Bitcoin Price Forecast: BTC pressured amid ETF outflows, fresh US-Iran risks
Bitcoin (BTC) remains under pressure, trading below $78,200 at the time of writing on Thursday after declining nearly 3% so far this week. Weakening institutional demand, along with escalating geopolitical tensions between the US and Iran near the Strait of Hormuz, continues to dampen risk appetite and weigh on the Crypto King. Institutional demand for Bitcoin shows early signs of caution.
Top Altcoins Price Forecast: Ripple, Solana, and Cardano risk deeper losses
Ripple (XRP), Solana (SOL), and Cardano (ADA) struggle to extend last month's advance, pointing to moderating buying pressure. The technical outlook for XRP, SOL, and ADA suggests a mild near-term bearish bias as momentum weakens. Ripple trades around $1.3800 at press time on Thursday, extending losses after a bearish close the previous day.
Crypto Today: Bitcoin, Ethereum and XRP lose bullish momentum as structural support holds
Cryptocurrency prices are moderating on Thursday, with Bitcoin (BTC) dropping to test the near-term $78,000 support. Altcoins, including Ethereum (ETH) and Ripple (XRP), are echoing Bitcoin’s cautious sentiment, with ETH retracing to approximately $2,470 and XRP to $1.38.
Bitcoin: Gearing up for a sharp move
Bitcoin (BTC) is trading around $81,000 on Friday, up over 4% so far this week, and awaits a key catalyst that could determine its next directional move. Strong institutional demand is supporting the bullish price action, with spot BTC Exchange Traded Funds (ETFs) on track to record a third straight week of inflows.



