Top trending altcoins SOL, BNB and ADA: Faces a correction as BTC falls below $92,000
- Solana continues its decline, dropping below $230 on Tuesday after declining more than 7% the previous day.
- Binance Coin faces rejection from weekly resistance around $661, indicating a further decline.
- Cardano extended its correction on Tuesday after hitting a new yearly high of $1.15 last week.

The prices of trending altcoins Solana (SOL), Binance Coin (BNB) and Cardano (ADA) continued to decline on Tuesday, driven by Bitcoin (BTC) drop below $92,000 and its early-week correction. The technical outlook suggests that these altcoins could decline further, retesting their key supports and providing buying opportunities for sideline investors.
Solana bulls show signs of exhaustion
Solana price on the weekly chart shows that the fourth biggest crypto asset by market capitalization reached a new all-time high (ATH) of $264.39 last week. However, it faces a pullback this week and trades down around $224 on Tuesday.
If SOL continues its decline, it could extend it to find support around its weekly level of $183.88, roughly coinciding with the 50% and 61.8% Fibonacci levels of $187.2 and $168.98, respectively (drawn from the August low of $110.00 to a mid-November high of $264.39). Sideline investors looking for buying opportunities may consider the levels mentioned above.
The Relative Strength Index (RSI) momentum indicator on the weekly chart trades at 62, pointing downwards after being rejected for the overbought level of 70, suggesting weakness in price momentum.
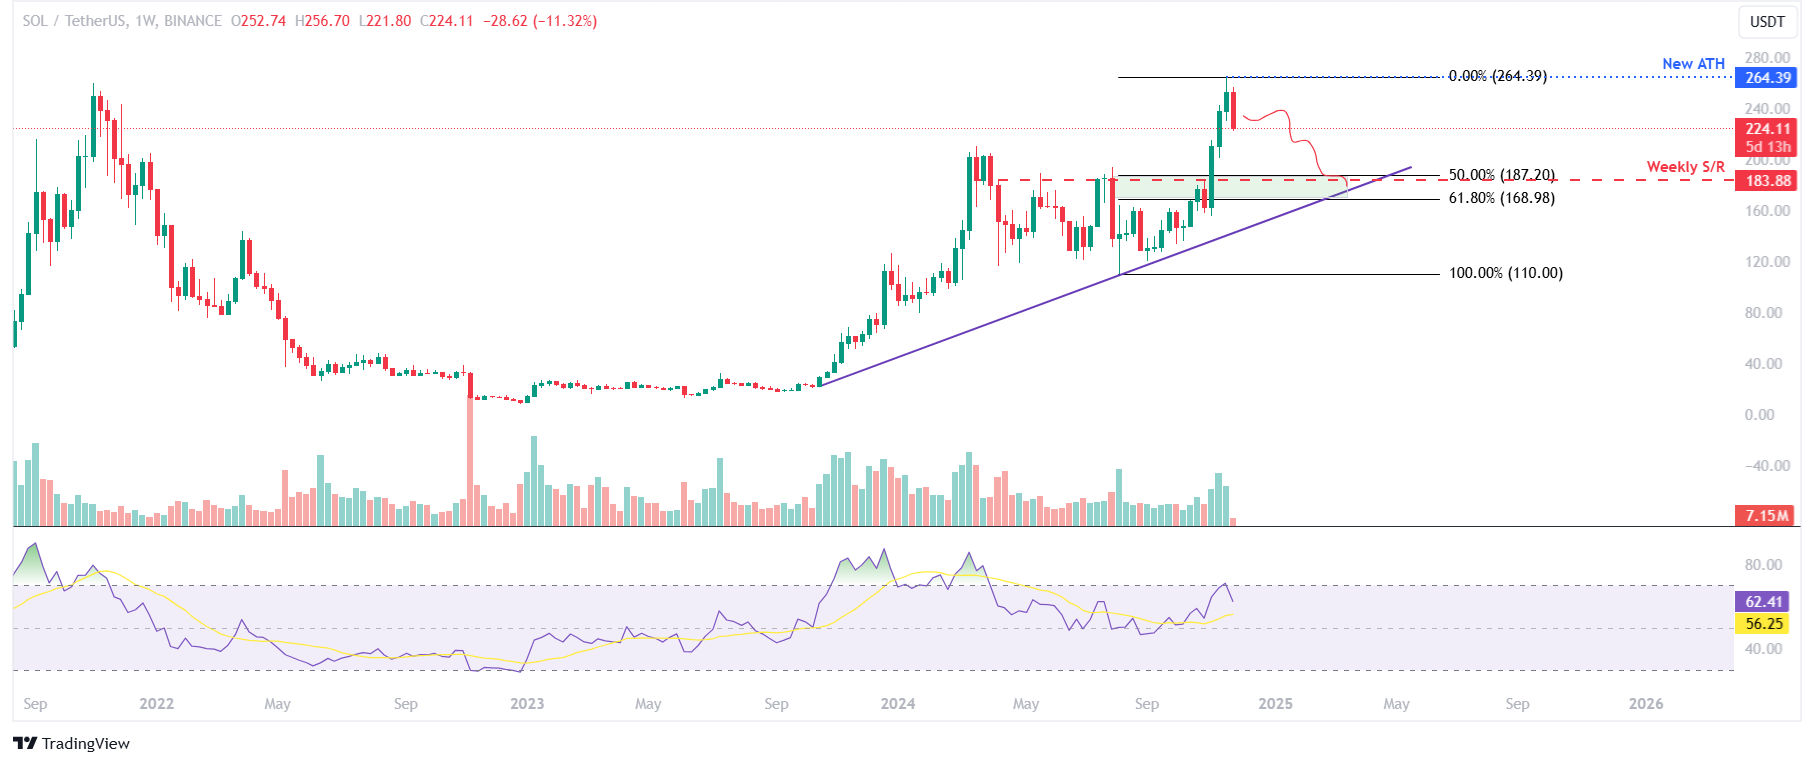
SOL/USDT weekly chart
Binance Coin is poised for a decline as it fails to close above weekly resistance
Binance Coin price failed to close above the weekly resistance of $661.74 last week. This week, it declined 6.38%, trading around $617.58 until Tuesday.
If BNB continues its correction, it could retest its weekly support at $528.90, roughly coinciding with the 50% and 61.8% Fibonacci levels of $543.54 and $509.67, respectively (drawn from the August low of $400 to a mid-November high of $687.09). Sideline investors looking for buying opportunities can do so between the abovementioned levels.
The RSI momentum indicator on the weekly chart trades at 55, pointing downwards and suggesting weakness in bullish momentum.
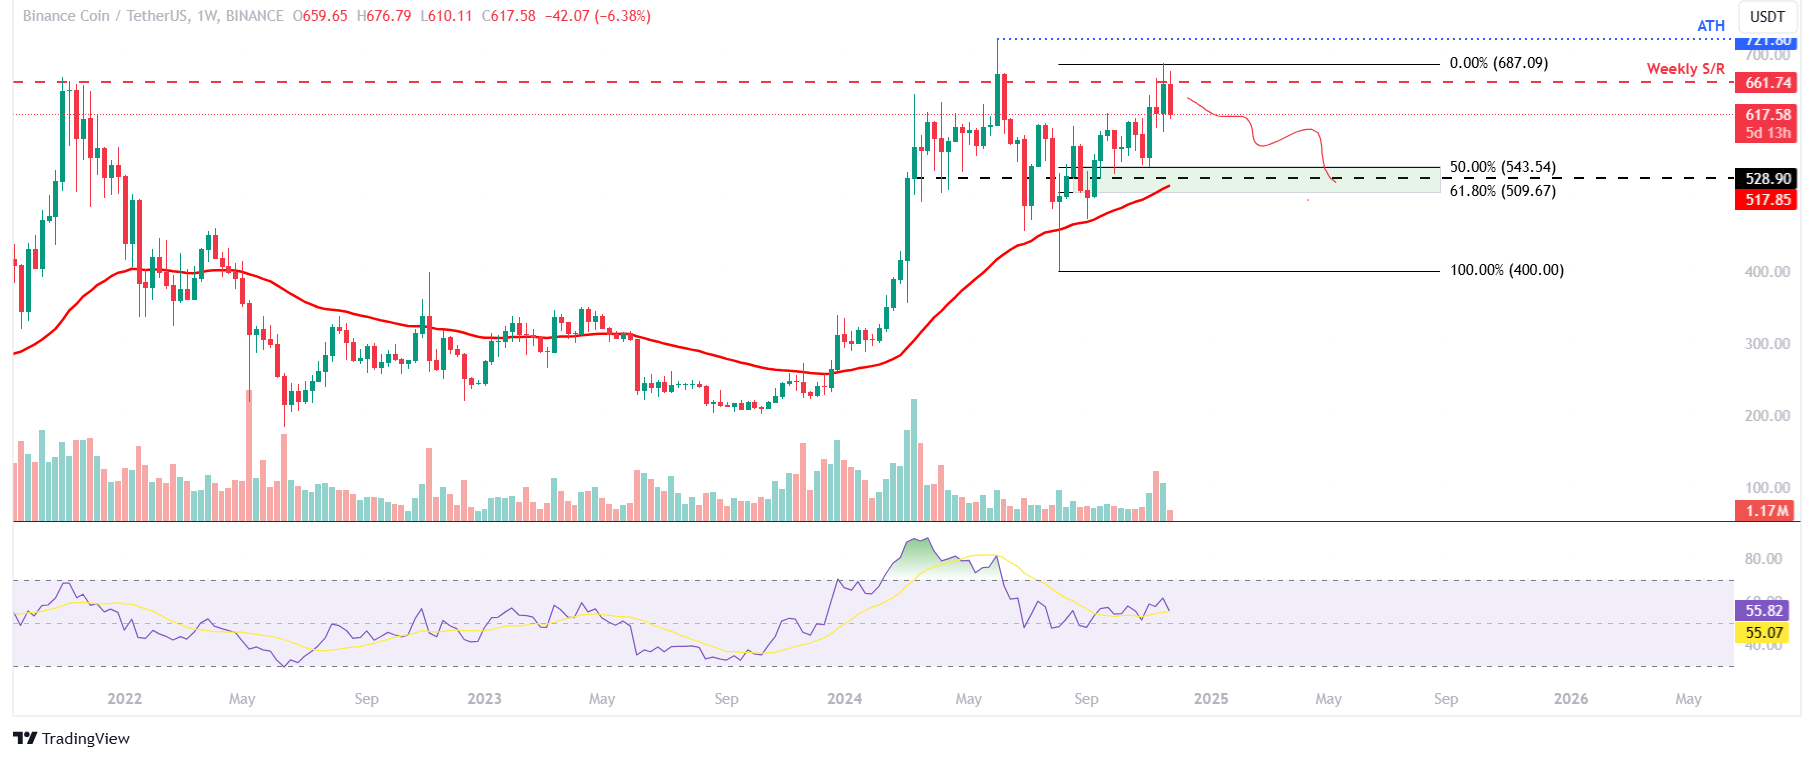
BNB/USDT weekly chart
Cardano price faces a pullback after a massive rally
Cardano price rallied by 46% last week, hitting a new yearly high of $1.15 on Friday, according to the weekly chart. At the start of this week, it faces a correction and trades around $0.878 on Tuesday.
If ADA continues its pullback, it could retest its monthly support at $0.654, roughly coinciding with the 50% and 61.8% Fibonacci levels of $0.613 and $0.718, respectively (drawn from the August low of $0.275 to a mid-November high of $1.16). Sideline investors looking for buying opportunities can be found between the abovementioned levels.
The RSI momentum indicator on the weekly chart trades at 70, pointing downwards and suggesting weakness in bullish momentum.
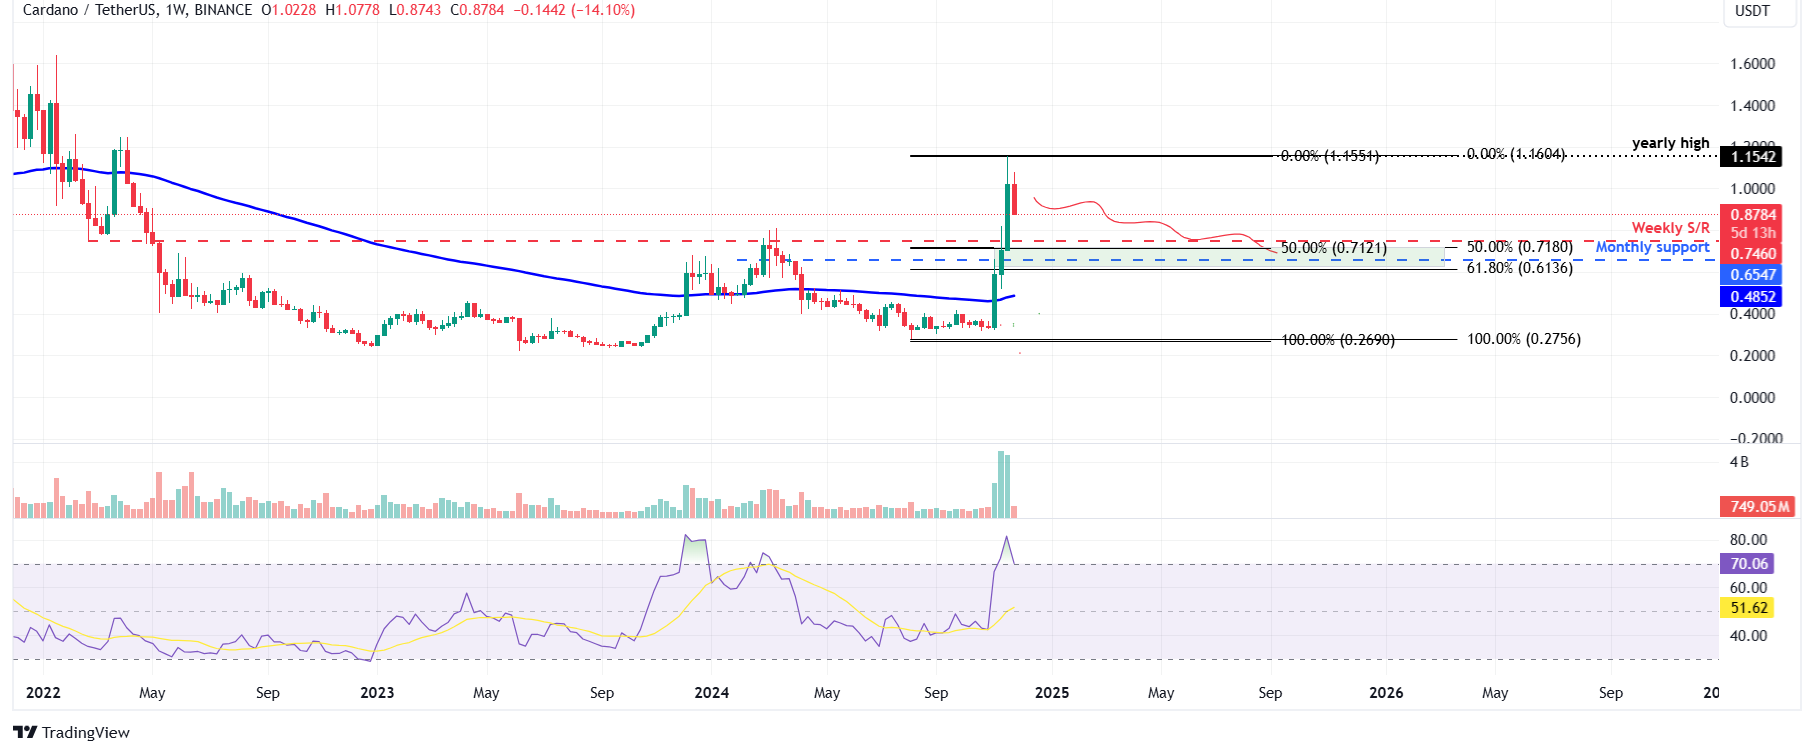
ADA/USDT weekly chart
Author

Manish Chhetri
FXStreet
Manish Chhetri is a crypto specialist with over four years of experience in the cryptocurrency industry.



