Bitcoin Price Forecast: BTC drops below $93,000 due to leverage overheating and profit-taking

Bitcoin price today: $92,400
- Bitcoin drops below $93,000 on Tuesday after declining almost 5% the previous day.
- CryptoQuant data shows leverage overheating as open interest and leverage ratios hit annual highs, with short-term holders taking profits.
- On-chain data shows $150 million in Bitcoin liquidations and $435 million outflows from spot ETFs, highlighting shifting market sentiment.
- The technical outlook shows a bearish divergence in RSI, signaling weakness in bullish momentum.
Bitcoin (BTC) continues to trade in the red, dropping below $93,000 on Tuesday after declining almost 5% the previous day. CryptoQuant data shows that the recent price pullback is due to leverage overheating conditions and holders’ booking profits in BTC, resulting in $150 million in Bitcoin liquidations in the last 24 hours and $435 million in spot BTC Exchange Traded Funds (ETF) outflows on Monday.
The technical outlook further supports the price correction, as the Relative Strength Index (RSI) shows a bearish divergence.
Bitcoin price dips below $93,000
Bitcoin price faces a pullback after it failed to reach its $100,000 milestone on Friday and declined nearly 6%, reaching a low of $92,600 on Monday. This price correction triggered a wave of liquidations across the crypto market, resulting in $520 million in total liquidations in the last 24 hours, almost $150 million specifically in BTC, according to data from CoinGlass.
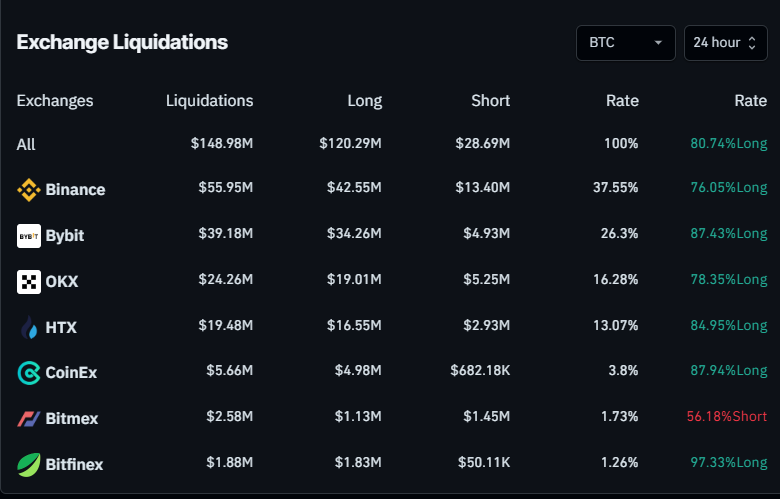
Bitcoin Liquidations chart. Source: Coinglass
CryptoQuant data provides a clearer picture of the recent pullback. This correction occurred due to leverage overheating, as open interest and estimated leverage ratio reached annual highs. Therefore, a 10-20% correction can be seen as a natural phenomenon.
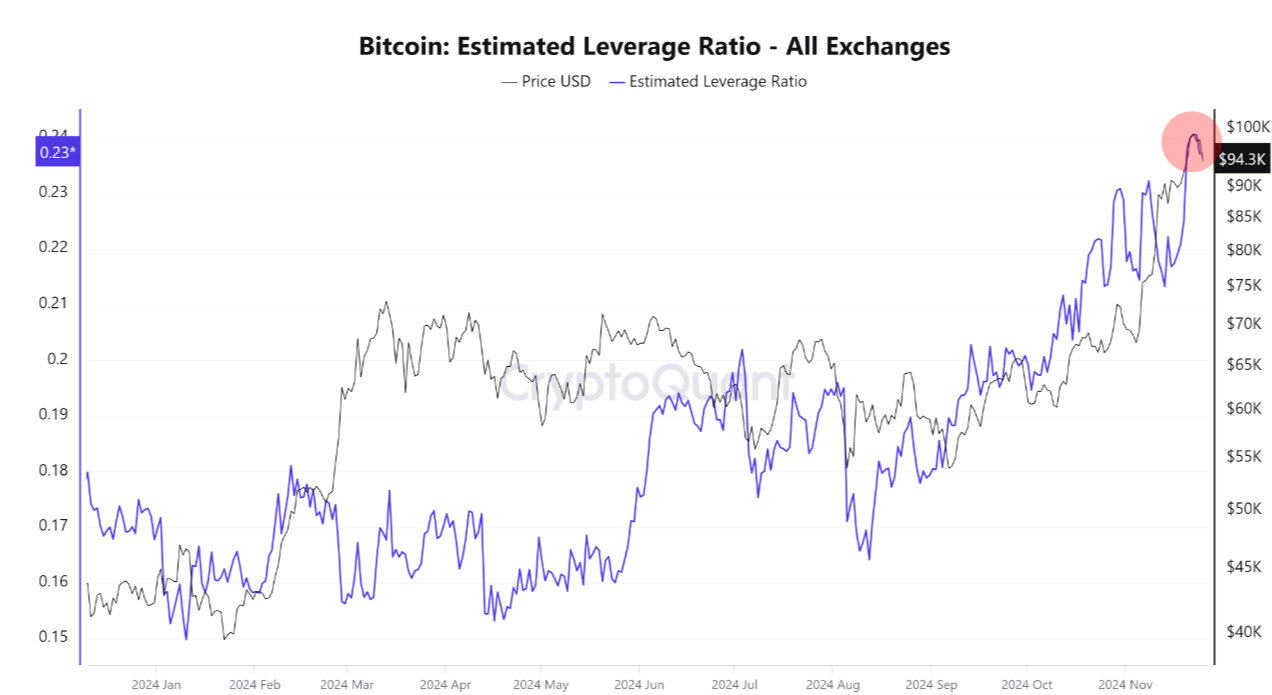
Bitcoin Estimated Leverage Ratio Source: CryptoQuant
As mentioned in the previous article on Monday, short-term holders are realizing profits. The Short-Term Spent Output Profit Ratio (SOPR) indicator measures profits realized on coins held for more than 1 hour but less than 155 days. For this analysis, short-term investors hold Bitcoin for less than 155 days.
Historically, when using a 30-day moving average to the Short-Term SOPR, it has been observed that during bullish trends, the metric tends to reach around 1.02 before profit-taking occurs. Each time this level has been reached, Bitcoin’s price has experienced a pullback or correction.
On Tuesday, the metric read 1.01, suggesting that Bitcoin’s price could continue its ongoing short-term correction.
-638682117186804131.png)
Bitcoin Short-term Holders chart. Source: CryptoQuant
The recent retracement could be clearly seen as institutional demand fell on Monday. According to Coinglass ETF data, US spot Bitcoin ETFs experienced an outflow of $435.30 million on Monday, breaking the streak of inflows since November 18. If this outflow trend persists or accelerates, it could further extend the ongoing decline in Bitcoin price.
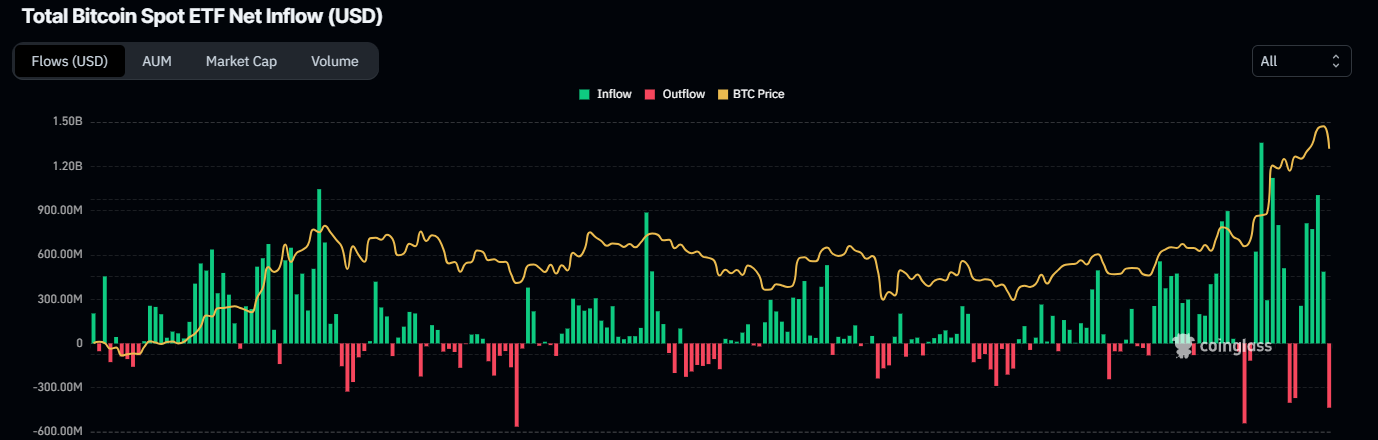
Total Bitcoin Spot ETF Net Inflow chart. Source: Coinglass
In an exclusive interview on Friday, Geoff Kendrick, Global Head of Digital Assets Research at Standard Chartered, told FXStreet, “You can certainly argue when something goes up 30%, you can have pullbacks because markets can get a little bit ahead of themselves (...) The ETFs are kind of buying on any dip, so that should help cushion any sell-offs.”
From an on-chain perspective, cycle metrics such as Market Value Realised Value (MVRV), Net Unrealized Profit and Loss (NUPL), and Puell Multiple still indicate that Bitcoin is in a bull market with upward potential.
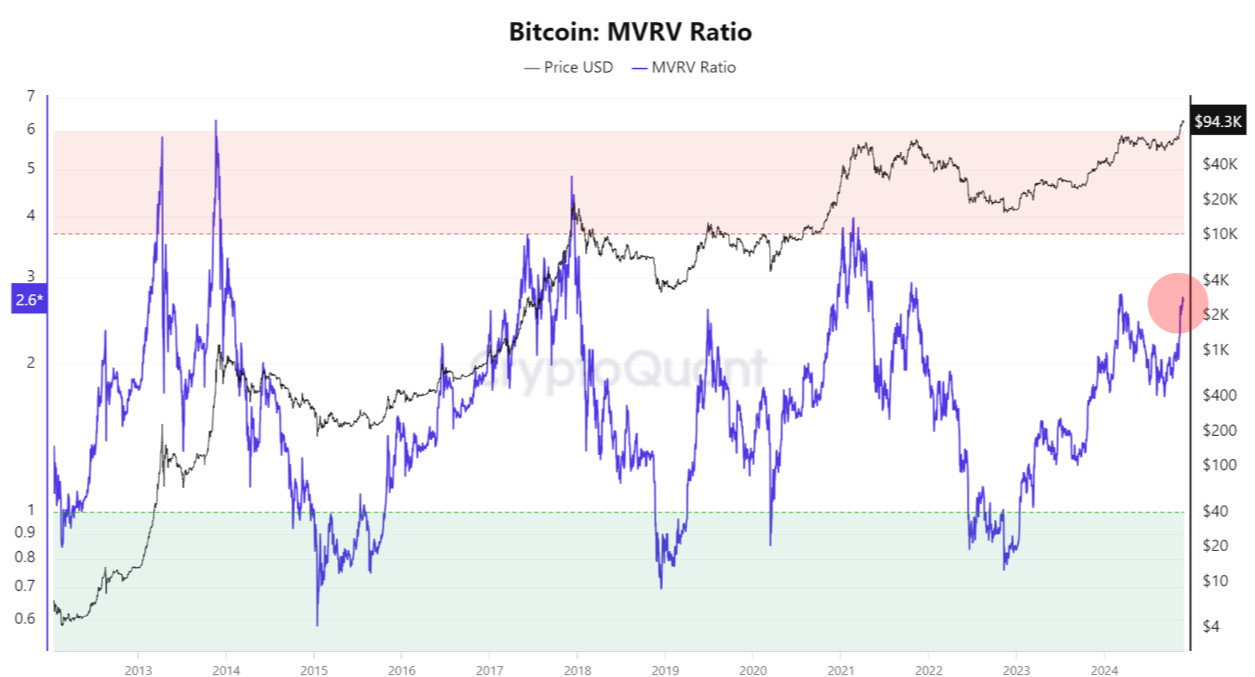
Bitcoin MVRV Ratio chart. Source: CryptoQuant
Bitcoin Price Forecast: RSI shows bearish divergence
Bitcoin price rallied more than 40% in the last three weeks, hitting a new all-time high (ATH) of $99,588 on Friday. The failure to reach above the $100,000 mark led to a nearly 6% price pullback, falling to a low of $92,700 on Monday. At the time of writing on Tuesday, BTC continues to decline and trades around $92,380.
If BTC’s pullback continues, it could extend the decline to retest its important psychological level of $90,000. A successful close below this level would extend the additional decline to test its next support level at $85,000.
Moreover, the Relative Strength Index (RSI) indicator supports this price pullback in the daily chart. The higher high in BTC’s price formed on Friday does not reflect the RSI lower high for the same period. This development is termed a bearish divergence, often leading to a trend reversal or short-term crash.
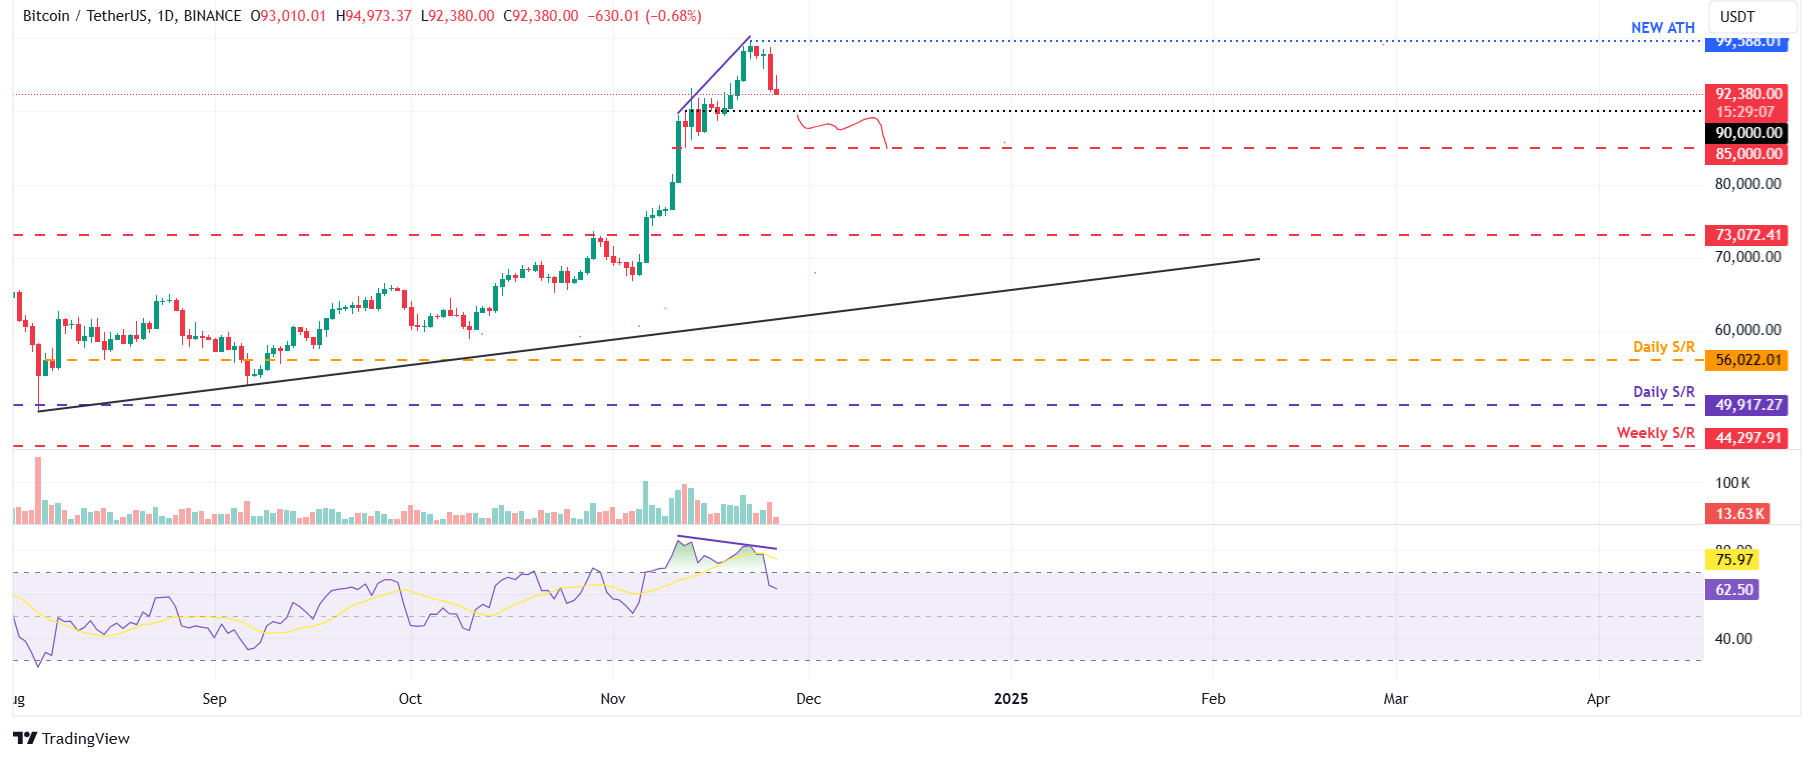
BTC/USDT daily chart
However, if BTC finds support around the $90,000 level and recovers, it could rally to reach its ATH level of $99,588.
Bitcoin, altcoins, stablecoins FAQs
Bitcoin is the largest cryptocurrency by market capitalization, a virtual currency designed to serve as money. This form of payment cannot be controlled by any one person, group, or entity, which eliminates the need for third-party participation during financial transactions.
Altcoins are any cryptocurrency apart from Bitcoin, but some also regard Ethereum as a non-altcoin because it is from these two cryptocurrencies that forking happens. If this is true, then Litecoin is the first altcoin, forked from the Bitcoin protocol and, therefore, an “improved” version of it.
Stablecoins are cryptocurrencies designed to have a stable price, with their value backed by a reserve of the asset it represents. To achieve this, the value of any one stablecoin is pegged to a commodity or financial instrument, such as the US Dollar (USD), with its supply regulated by an algorithm or demand. The main goal of stablecoins is to provide an on/off-ramp for investors willing to trade and invest in cryptocurrencies. Stablecoins also allow investors to store value since cryptocurrencies, in general, are subject to volatility.
Bitcoin dominance is the ratio of Bitcoin's market capitalization to the total market capitalization of all cryptocurrencies combined. It provides a clear picture of Bitcoin’s interest among investors. A high BTC dominance typically happens before and during a bull run, in which investors resort to investing in relatively stable and high market capitalization cryptocurrency like Bitcoin. A drop in BTC dominance usually means that investors are moving their capital and/or profits to altcoins in a quest for higher returns, which usually triggers an explosion of altcoin rallies.
Author

Manish Chhetri
FXStreet
Manish Chhetri is a crypto specialist with over four years of experience in the cryptocurrency industry.


