Cardano Price Forecast: ADA could rally by another 30% as on-chain data signals bullish sentiment

Cardano price today: $0.98
- Cardano weekly active addresses crossed 350K for the first time since June 2023.
- Despite ADA investors holding an average profit of 75%, on-chain data shows more room for price growth.
- ADA futures open interest hit a three-year high of $725.83 million amid increased buying pressure across its spot market.
- ADA eyes a 30% rally to $1.26 after smashing three-year resistance at $0.908.
Cardano (ADA) surged 24% to $0.98 on Friday following rising weekly active addresses, increased open interest and spot buying pressure.
ADA on-chain metrics paint bullish outlook
Cardano's weekly active addresses have been at elevated levels since the crypto market rally began on November 6 following President-elect Donald Trump’s election win. Despite the market seeing corrections on several occasions, it has maintained its uptrend, crossing 350K weekly active addresses for the first time since June 2023.
This shows that the increased ADA price growth isn't only fueled by whale buying activity but also by network usage.
 [21.23.13, 22 Nov, 2024]-638679067971248449.png)
ADA Weekly Active Addresses | Santiment
Meanwhile, ADA's Market Value to Realized Value (MVRV) ratio, which measures the average profit or loss of all investors based on the time their tokens last moved, has risen past 75% — levels last seen in the 2021 bull market run. This indicates that all ADA investors are holding an average profit of 75% on their original investment. When profits rise to such elevated levels, holders may begin booking profits gradually, which may cause a slight price downturn.
 [21.24.44, 22 Nov, 2024]-638679068499113801.png)
ADA MVRV Ratio | Santiment
This is evident in Santiment's data, which shows ADA investors realized over $200 million in profits in the past two days. However, the realized profits are still lower than levels seen during the crypto market rally in March, indicating most investors are still holding onto their tokens in anticipation of continued price growth.
 [21.23.53, 22 Nov, 2024]-638679069030722391.png)
ADA Network Realized Profits/Loss | Santiment
The ADA MVRV Long/Short Difference, which shows the difference between the 365-day and 60-day MVRV ratio, confirms the potential for the Cardano price to grow more as it is still at 18%. Historically, this metric crosses the 50% mark before ADA begins to see a correction.
 [21.21.08, 22 Nov, 2024]-638679069427571125.png)
ADA MVRV Long/Short Difference | Santiment
Meanwhile, ADA's futures open interest (OI) surged to a three-year high of $725.83 million on Thursday, per Coinglass data. Open interest is the total number of outstanding contracts in a derivatives market. The increase in OI, accompanied by a respective price growth, signifies confidence in the uptrend.
The ADA spot exchange volume and net flow data align with the bullish outlook, showing increased trading and exchange outflows in the past week.
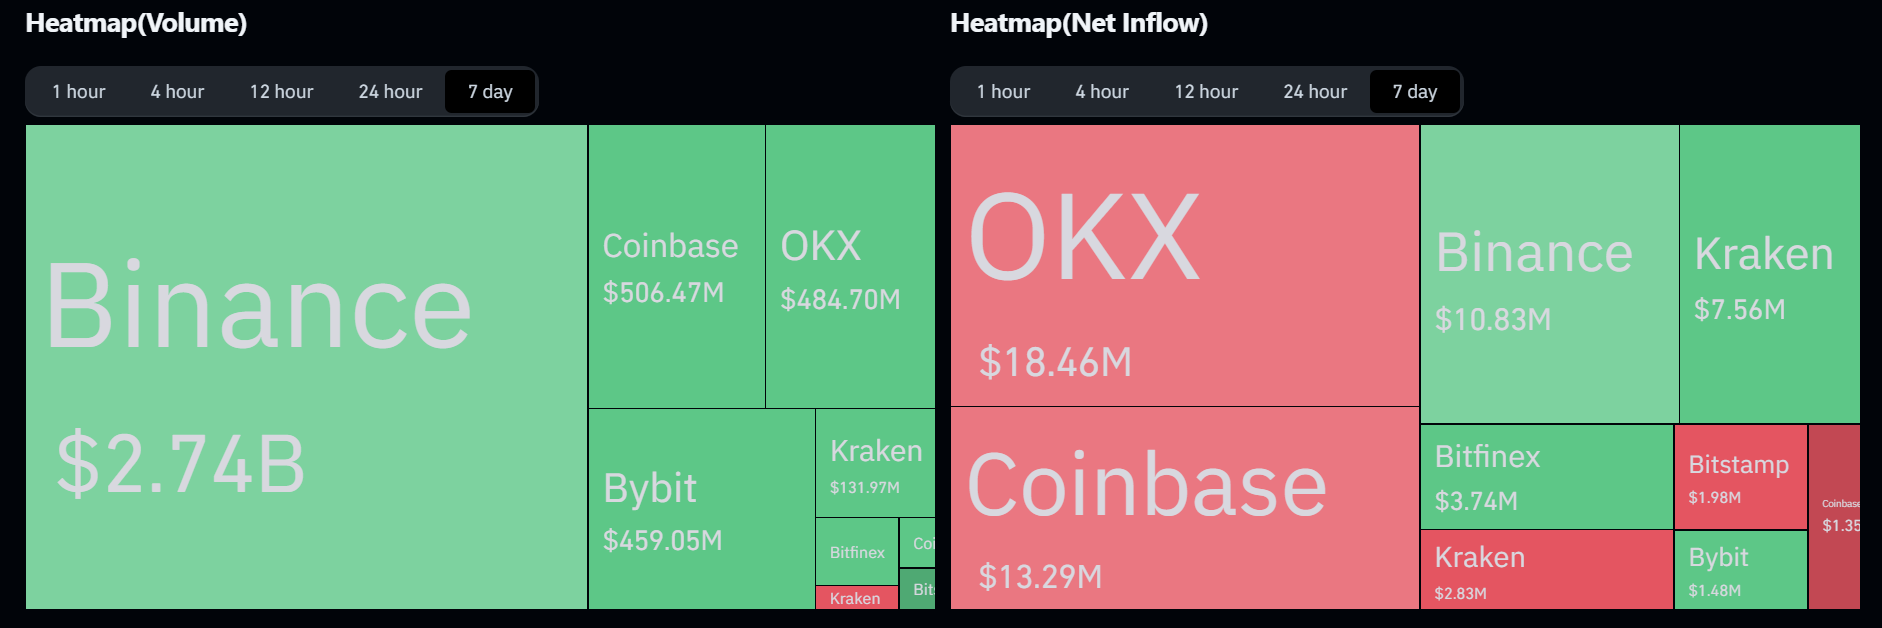
ADA Spot Exchange Volume & Net Flow | Coinglass
ADA could extend rally to $1.26 after 22% in the past 24 hours
ADA's 24% surge sparked over $12 million in liquidations, with liquidated long and short positions accounting for $3.79 million and $8.60 million, respectively.
ADA could rally nearly 30% above the $1 mark toward $1.263 after smashing the $0.908 resistance level of April 2022.
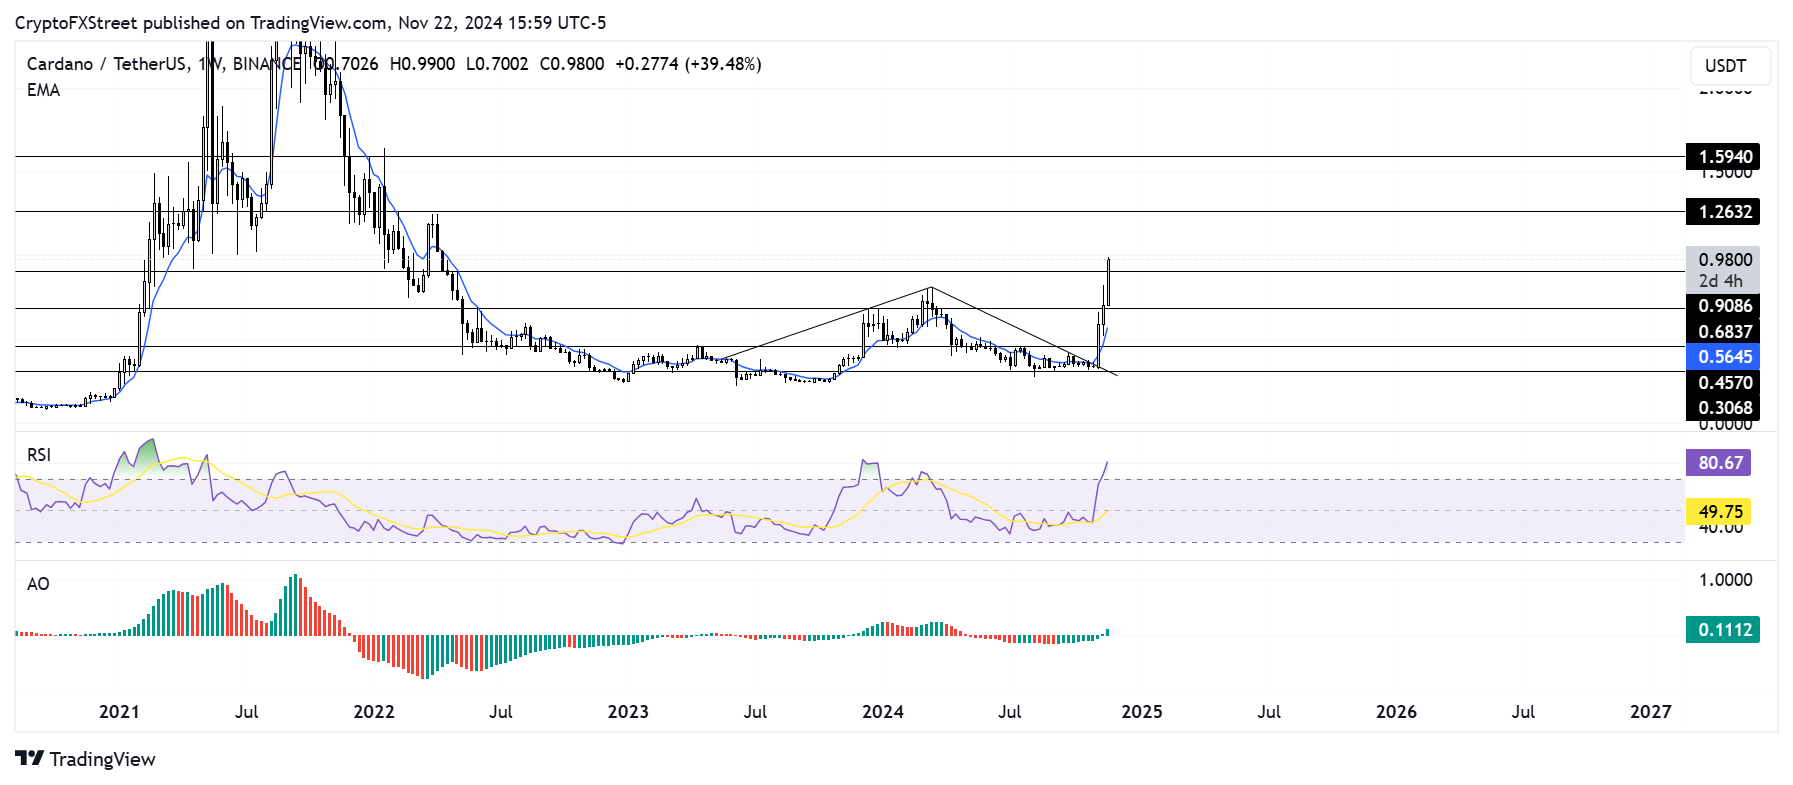
ADA/USDT weekly chart
However, the Relative Strength Index (RSI) is in the oversold region at 80, indicating that ADA could see a potential price correction soon. The Awesome Oscillator has crossed above the neutral level for the first time since April, indicating rising bullish momentum.
A daily candlestick close below $0.683 will invalidate the bullish thesis.
Author

Michael Ebiekutan
FXStreet
With a deep passion for web3 technology, he's collaborated with industry-leading brands like Mara, ITAK, and FXStreet in delivering groundbreaking reports on web3's transformative potential across diverse sectors. In addition to


