Top 3 Price Prediction Bitcoin, Ethereum, XRP: Bears take over and draw a bloody moon
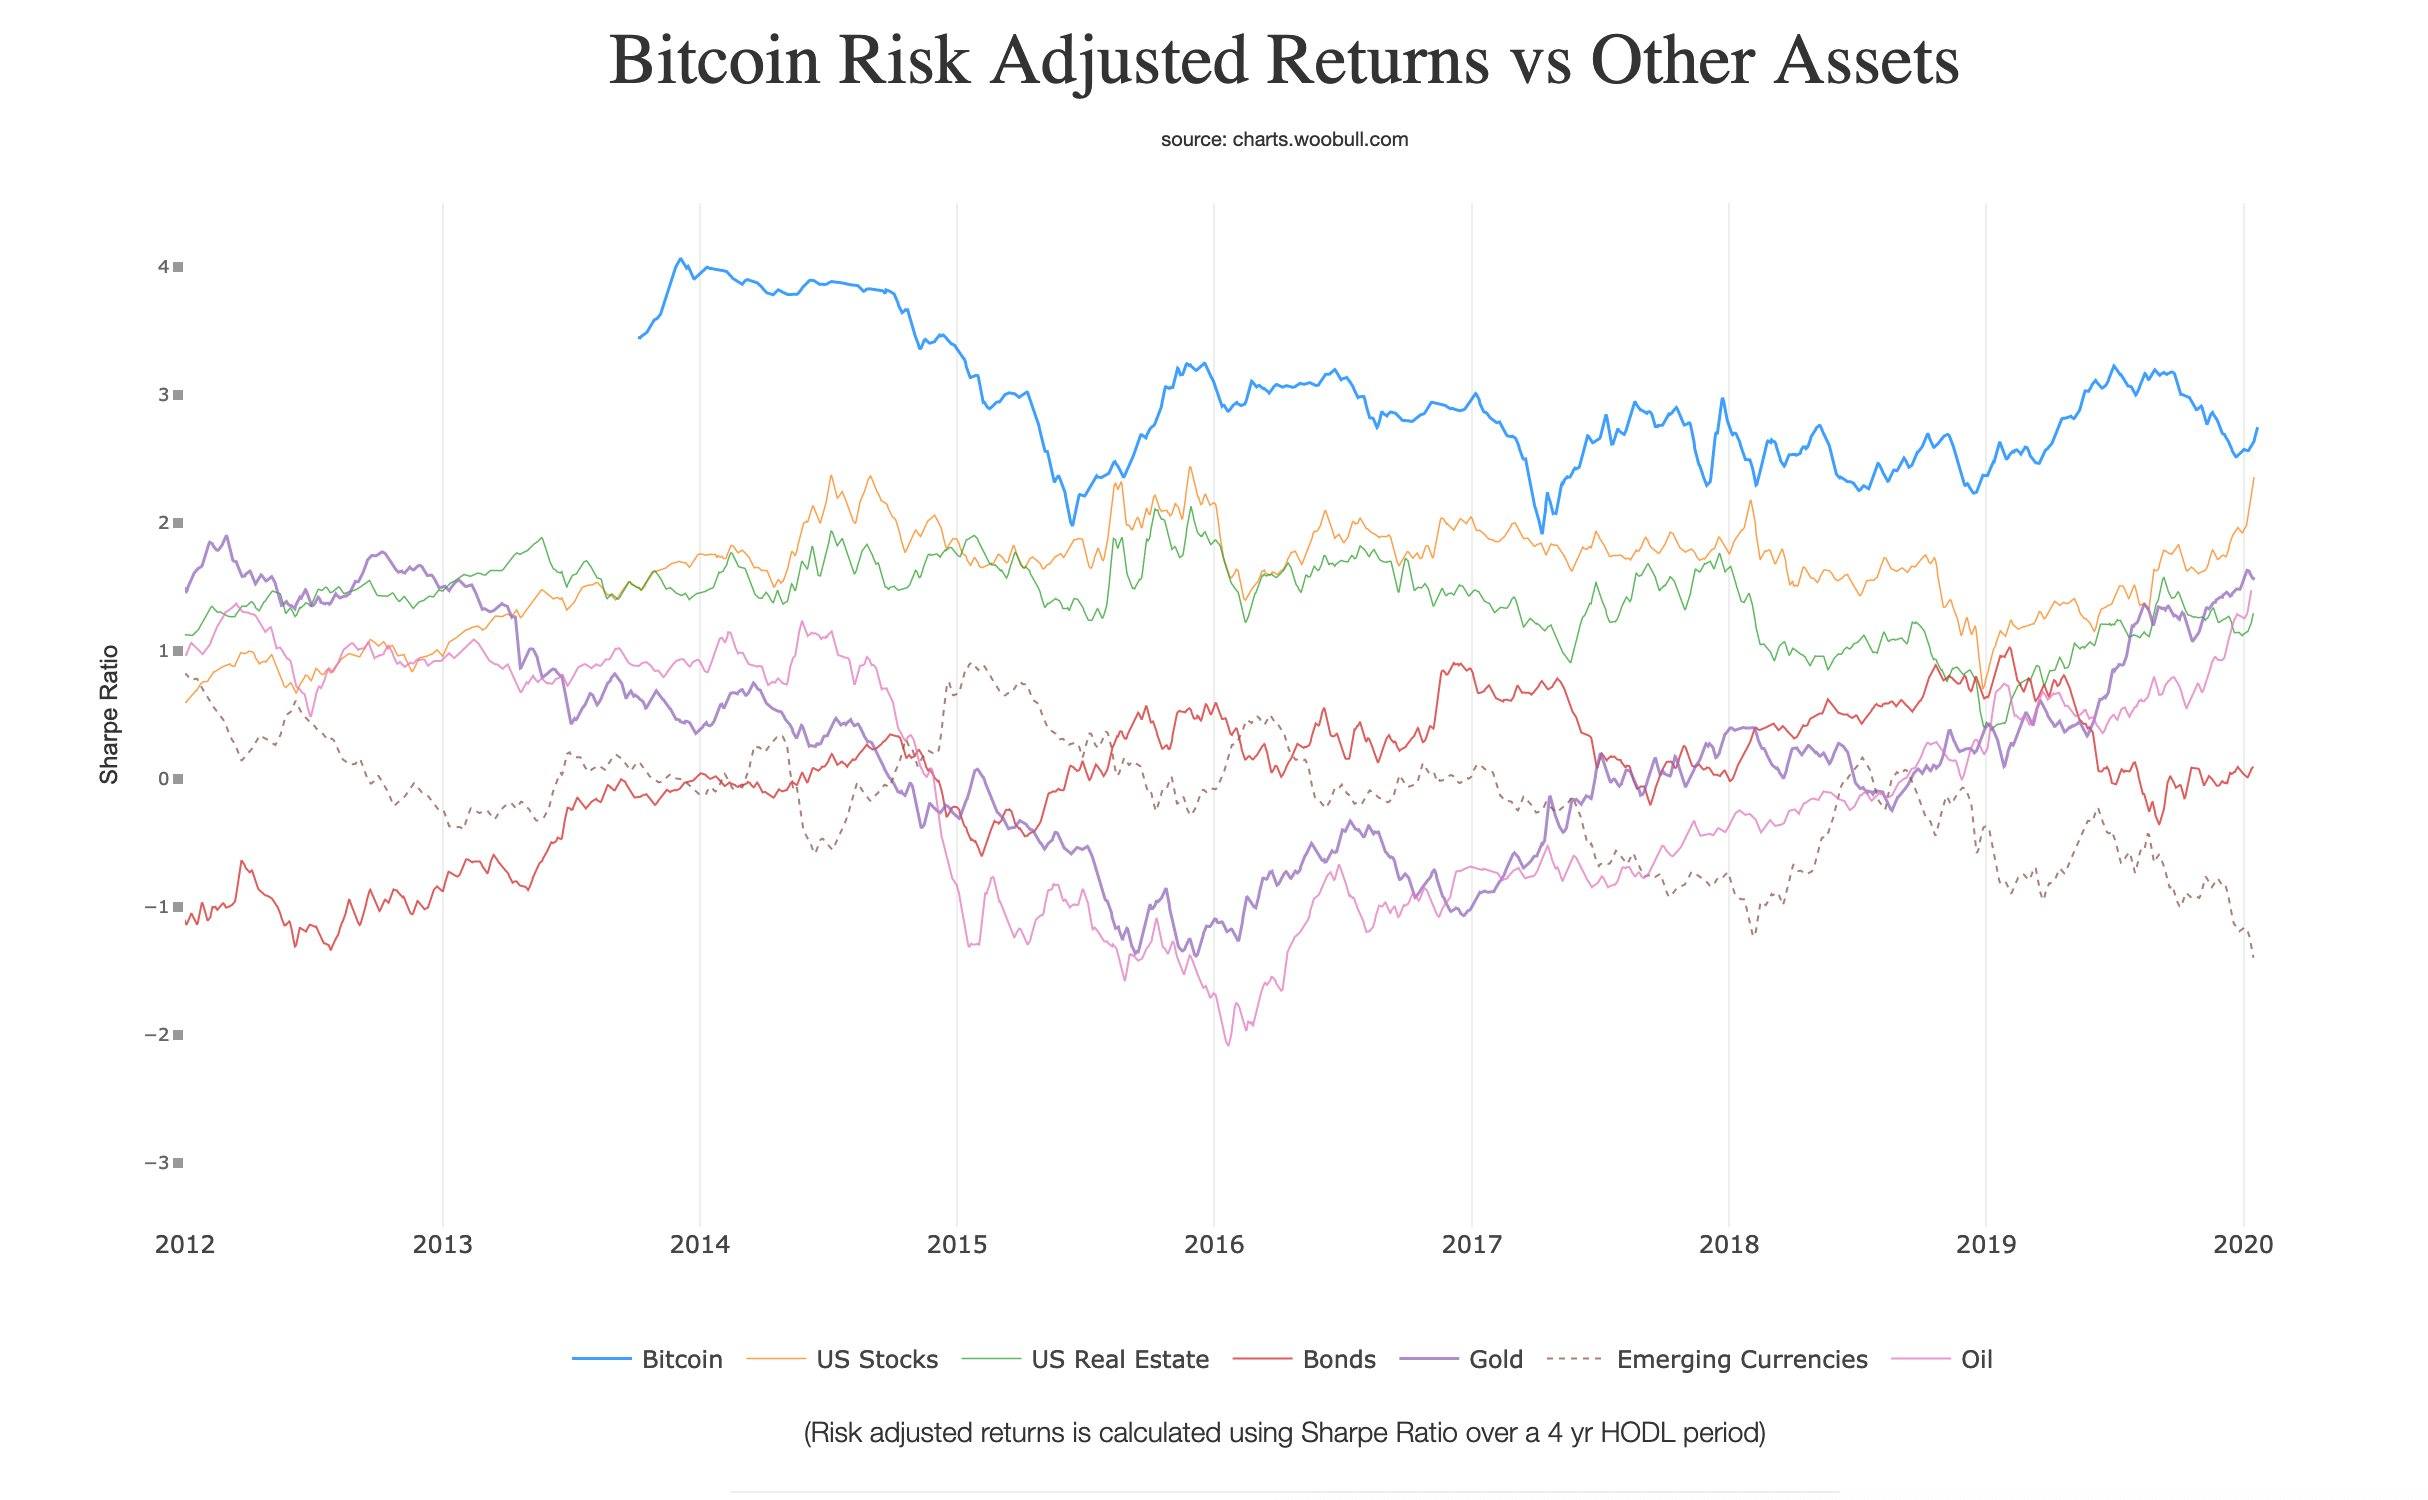
- Despite appearances, Bitcoin is the asset with the best risk/benefit ratio.
- The current falls are adjusted to the ranges of the previous rise.
- Downward momentum expires in the first half of February.

Cryptographer and computer scientist Nick Szabo, has presented in his Twitter account a study on the "risk-benefit" ratio of different assets. The study used a Sharpe Ratio over four years Hodl period.
According to this study, Bitcoin is the best positioned, maintaining an average ratio of 3 in the last four years. Behind them are the US stocks, with an average ratio of 2, and gold, which has gone from the last positions in 2016 to the third in the 2020 ratio.
The worst placed asset category is emerging currencies, which with an average ratio of -2 lags far behind the others.
The crypto board reaches the end of the week with the bears securing the market control they gained yesterday in mid-session.
The structure of the moving averages already indicated that the upward turning process that began on January 10th was going to be quite time-consuming. The magnitude of the downward movements in the second half of 2019 had separated the moving averages a lot.
ETH/BTC 4-Hours Chart
ETH/BTC is trading at the price level of 0.01895 and is down by -1.65%. On the 4-hour chart, the spot price is piercing the EMA50. If Ethereum loses this support, the drop will accelerate to the 0.0185 level.
Above the current price, the first resistance level is at 0.0197, then the second at 0.0200 and the third one at 0.0205.
Below the current price, the first support level is at 0.0185, then the second at 0.0185 and the third one at 0.0182.
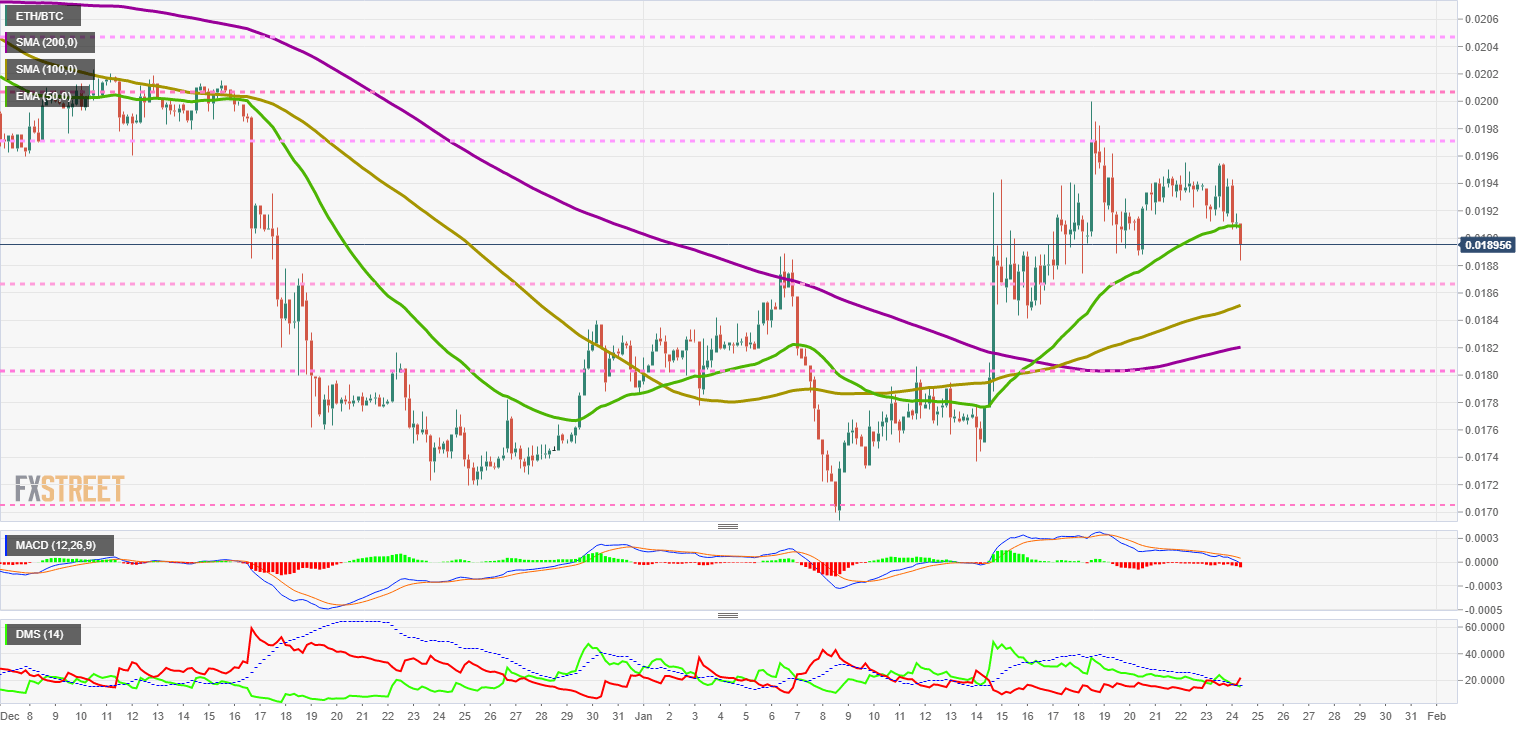
The MACD on the 4-hour chart is supported directly by the indicator's zero levels. The moving averages are sloping downward and are moving away from it, suggesting an acceleration of the trend.
The DMI on the 4-hour chart shows the bearish-bought pair in equilibrium. Both sides of the market are above the ADX line, a setup that facilitates violent resolutions.
BTC/USD 4-Hours Chart
BTC/USD is currently trading at $8243 and confirms the loss of support at $8400. The EMA50 and SMA100 averages continue to fall and forecast that the end of the downtrend could be on the first week of February.
Above the current price, the first resistance level is at $8400, then the second at $8500 and the third one at $8800.
Below the current price, the first support level is at $8200, then the second at $8000 and the third one at $7900.
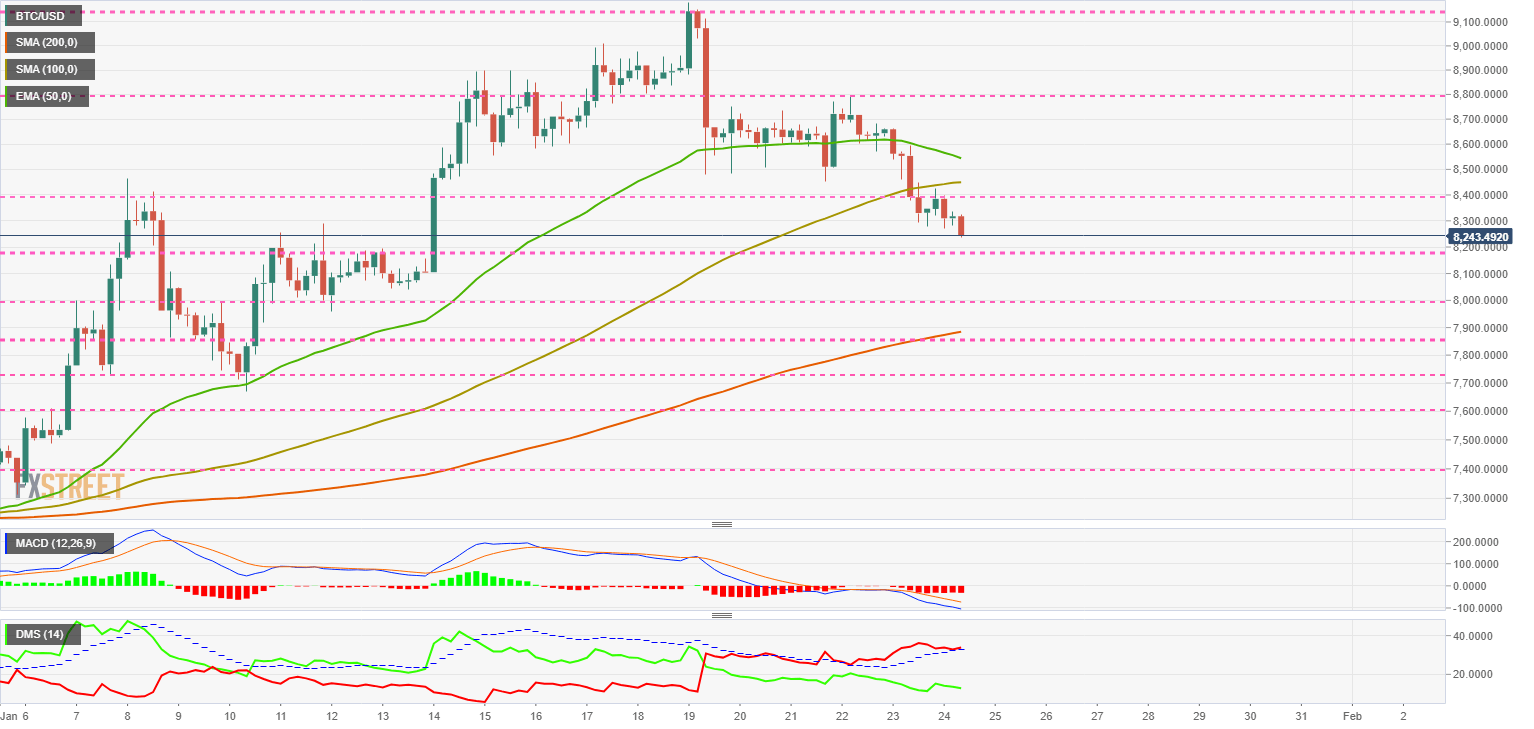
The MACD on the 4-hour chart is losing its downward slope, indicating the end of the impulse phase of the movement. The terminal phase can easily take the price below $8000.
The DMI on the 4-hour chart confirms the end of the bearish momentum phase. Bears are preparing to drill down the ADX line. The bulls are very reactive to any upward movement and break the downward trend.
ETH/USD 4-Hours Chart
ETH/USD is currently trading at $156.09 after finding support at the SMA100. The support point coincides with the 38.2% level of the Fibonacci retracement system and the same system indicates that the 50% level at $150 is very likely to be visited.
Above the current price, the first resistance level is at $161, then the second at $165 and the third at $170.
Below the current price, the first support level is at $155, then the second at $150 and the third one at $143 (61.8% level of the Fibonacci retracement system).
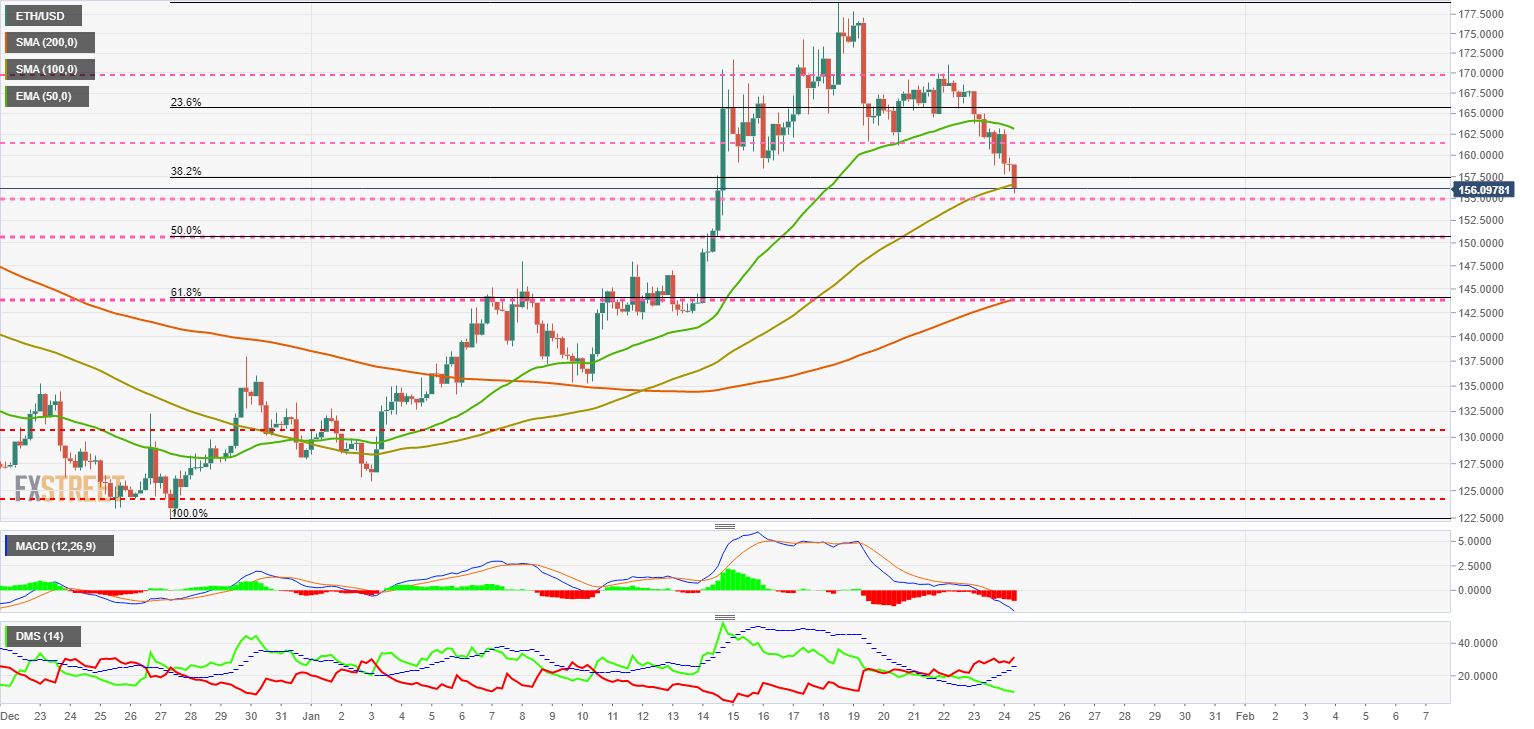
The DMI on the 4-hour chart shows that the bearish trend is increasing. The bulls are not reacting and continue to lose strength.
XRP/USD 4-Hours Chart
XRP/USD is currently trading at $0.215 and accelerating the downward movement that began this week. The current price coincides with the 50% level of the Fibonacci retracement system. The next support, according to this tool, is at the 0.205 price level, 61.8% of the Fibonacci retracement system.
Above the current price, the first resistance level is at $0.218, then the second at $0.223 and the third one at $0.235.
Below the current price, the first support level is at $0.205, then the second at $0.20 and the third one at $0.19.
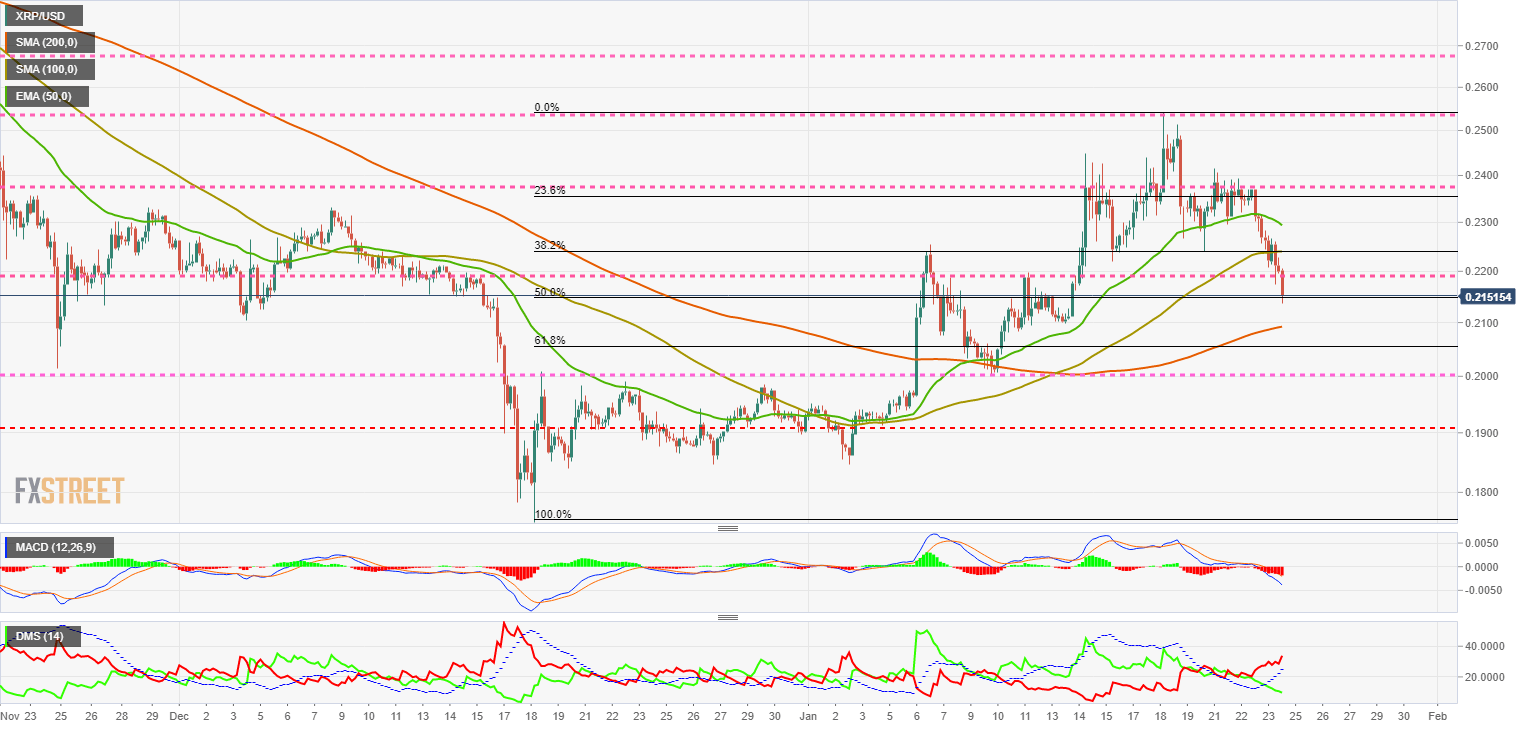
The MACD on the 4-hour chart shows an acceleration of the downward movement. The MACD on the 4-hour chart shows an acceleration of the downward movement.
The DMI on the 4-hour chart shows that the bearish trend is increasing and the bearish momentum is strong. The bulls are not reacting and continue to lose momentum.
Get 24/7 Crypto updates in our social media channels: Give us a follow at @FXSCrypto and our FXStreet Crypto Trading Telegram channel
Author

Tomas Salles
FXStreet
Tomàs Sallés was born in Barcelona in 1972, he is a certified technical analyst after having completing specialized courses in Spain and Switzerland. He expanded his technical training following the guidance of great experts on the financial markets.


