Top 3 Price Prediction Bitcoin, Ethereum, Ripple: Altcoins suffer in the wake of a weakening BTC
- Bitcoin price could rise to the $30,400 range as momentum rises but faces further decline amid increasing volatility on lower timeframes.
- Ethereum price losing the support at $1,826 means ETH could fall to the $1,782 level as investors exercise caution.
- Ripple price slips through critical support levels, eyes a 5% drop to $0.568 as traders cash in July 13 gains.

Bitcoin (BTC) recent price action has investors skeptical about altcoins, as its continued slump continues to harm the cryptocurrency market. This is best seen in Ethereum (ETH) price, which continues to slide south. The same is illustrated by Ripple (XRP) price, whose bulls are actively losing to the bears and losing the ground covered in the June 13 rally.
Open Interest, funding rate FAQs
How does Open Interest affect cryptocurrency prices?
Higher Open Interest is associated with higher liquidity and new capital inflow to the market. This is considered the equivalent of increase in efficiency and the ongoing trend continues. When Open Interest decreases, it is considered a sign of liquidation in the market, investors are leaving and the overall demand for an asset is on a decline, fueling a bearish sentiment among investors.
How does Funding rate affect cryptocurrency prices?
Funding fees bridge the difference between spot prices and prices of futures contracts of an asset by increasing liquidation risks faced by traders. A consistently high and positive funding rate implies there is a bullish sentiment among market participants and there is an expectation of a price hike. A consistently negative funding rate for an asset implies a bearish sentiment, indicating that traders expect the cryptocurrency’s price to fall and a bearish trend reversal is likely to occur.
Bitcoin price delays the inevitable
Bitcoin (BTC) action shows intense strife between bulls and bears as both extremes pull for dominance. The red and green candlesticks on the four-hour chart below point to this fact. Amid this volatility, experts predict BTC to run back to the $30,400 range this week before a potential drop down to the $27,300 and $26,300 levels.
As buying pressure increases from the bullish breaker, Bitcoin price could ascend, potentially breaching the 50-, 100- and 200-day Exponential Moving Averages (EMA) at $29,169, $29,339, and $29,438 levels, respectively. For the layperson, a bullish breaker is a failed demand or supply zone (demand zone in this case).
Further north, and with the Fair Value Gap (FVG) creating an imbalance that has to be filled, Bitcoin price could extend north to test this region at around the $30,400 level before a possible retracement. Such a move would constitute a 5% climb above the press time market value of $28,977. The Relative Strength Index (RSI) supports this outlook, tipping north to show rising momentum.
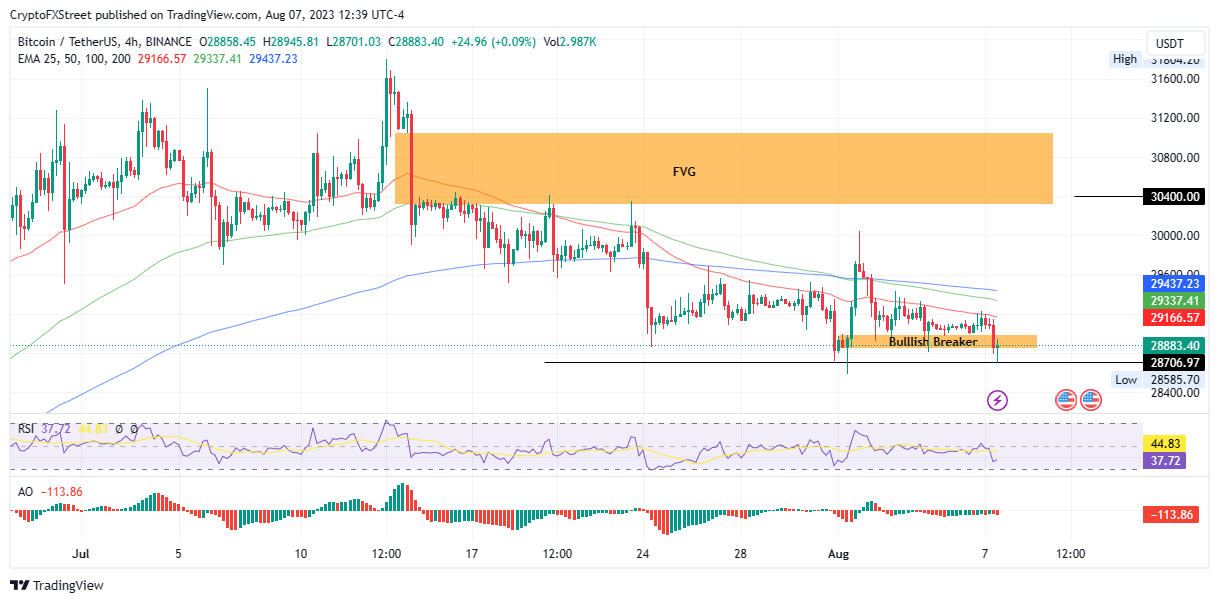
BTC/USDT 4-hour chart
Conversely, if seller momentum outweighs bullish effort, Bitcoin price could continue south, with a decisive flip of the $28,706 support level into a resistance invalidating the optimistic outlook. If such an outcome prevails, BTC could extend south, possibly tagging the $27,300 support level, or in the dire case, extend a leg south to the $26,300 level. This would constitute a 10% slump.
Also Read: Bitcoin halving cycles show a weakening trend, similar to Litecoin, according to experts.
Bitcoin, altcoins, stablecoins FAQs
What is Bitcoin?
Bitcoin is the largest cryptocurrency by market capitalization, a virtual currency designed to serve as money. This form of payment cannot be controlled by any one person, group, or entity, which eliminates the need for third-party participation during financial transactions.
What are altcoins?
Altcoins are any cryptocurrency apart from Bitcoin, but some also regard Ethereum as a non-altcoin because it is from these two cryptocurrencies that forking happens. If this is true, then Litecoin is the first altcoin, forked from the Bitcoin protocol and, therefore, an “improved” version of it.
What are stablecoins?
Stablecoins are cryptocurrencies designed to have a stable price, with their value backed by a reserve of the asset it represents. To achieve this, the value of any one stablecoin is pegged to a commodity or financial instrument, such as the US Dollar (USD), with its supply regulated by an algorithm or demand. The main goal of stablecoins is to provide an on/off-ramp for investors willing to trade and invest in cryptocurrencies. Stablecoins also allow investors to store value since cryptocurrencies, in general, are subject to volatility.
What is Bitcoin Dominance?
Bitcoin dominance is the ratio of Bitcoin's market capitalization to the total market capitalization of all cryptocurrencies combined. It provides a clear picture of Bitcoin’s interest among investors. A high BTC dominance typically happens before and during a bull run, in which investors resort to investing in relatively stable and high market capitalization cryptocurrency like Bitcoin. A drop in BTC dominance usually means that investors are moving their capital and/or profits to altcoins in a quest for higher returns, which usually triggers an explosion of altcoin rallies.
Ethereum price indicates a potential slump
Ethereum (ETH) price is bleeding from a weakening BTC as the dominance of the king of crypto continues to wane. The largest altcoin by trading volume has lost critical support at $1,826, exposing it to a further decline as the presence of bulls in the market continues to fade.
Unless bulls resurface, Ethereum price could sink lower to record a new range low at around $1,782. This outlook is bolstered by falling momentum as indicated by the dropping RSI, and the Awesome Oscillators (AO) histograms continue turning red.
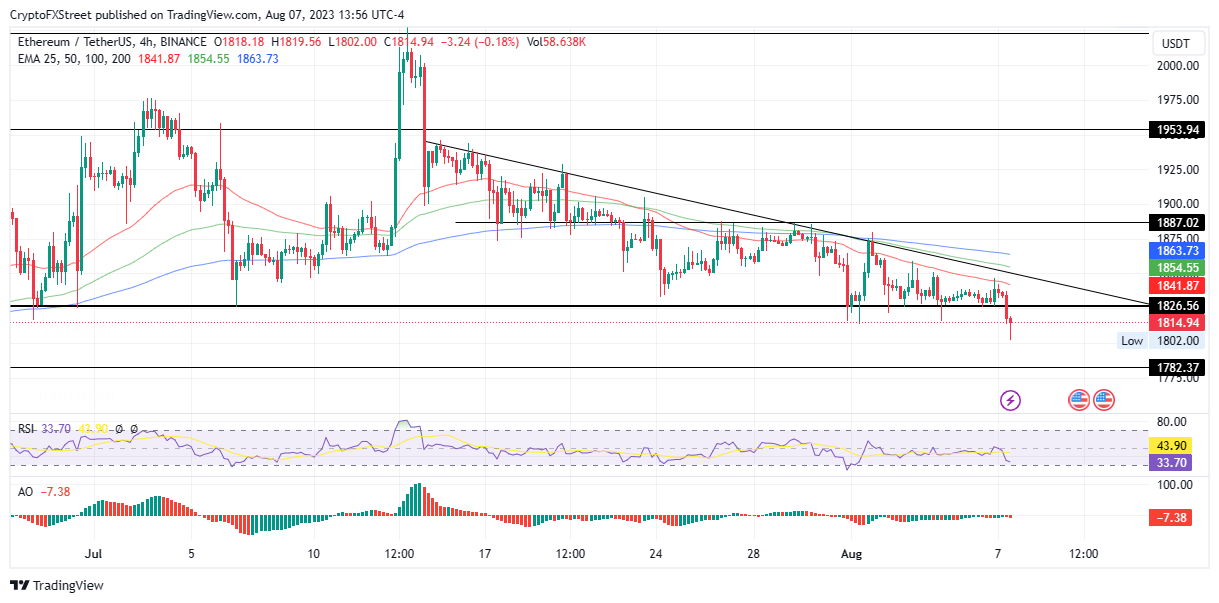
ETH/USDT 4-hour chart
On the other hand, bulls resurfacing could see Ethereum price change direction, potentially restoring above the $1,826 support level as the market stabilizes following collected liquidity represented by the numerous candlestick wicks below the aforementioned level.
Further north, Ethereum price could breach the roadblocks presented by the 50-day EMA at $1,815 and break above the downtrend line to tag the 100-day EMA at $1,854 – or higher, reac hing the 200-day EMA at $1,863.
Notwithstanding, Ethereum price remains in the woods until ETH makes a decisive move above the $1,887 resistance level. However, invalidation of the current gloomy outlook would occur upon a 4-hour candlestick close above the $1,953 hurdle.
Also Read: Coinbase Layer 2 Base mainnet locks in $34.22 million in assets two days before going live.
Cryptocurrency prices FAQs
How do new token launches or listings affect cryptocurrency prices?
Token launches like Arbitrum’s ARB airdrop and Optimism OP influence demand and adoption among market participants. Listings on crypto exchanges deepen the liquidity for an asset and add new participants to an asset’s network. This is typically bullish for a digital asset.
How do hacks affect cryptocurrency prices?
A hack is an event in which an attacker captures a large volume of the asset from a DeFi bridge or hot wallet of an exchange or any other crypto platform via exploits, bugs or other methods. The exploiter then transfers these tokens out of the exchange platforms to ultimately sell or swap the assets for other cryptocurrencies or stablecoins. Such events often involve an en masse panic triggering a sell-off in the affected assets.
How do macroeconomic releases and events affect cryptocurrency prices?
Macroeconomic events like the US Federal Reserve’s decision on interest rates influence risk assets like Bitcoin, mainly through the direct impact they have on the US Dollar. An increase in interest rate typically negatively influences Bitcoin and altcoin prices, and vice versa. If the US Dollar index declines, risk assets and associated leverage for trading gets cheaper, in turn driving crypto prices higher.
How do major crypto upgrades like halvings, hard forks affect cryptocurrency prices?
Halvings are typically considered bullish events as they slash the block reward in half for miners, constricting the supply of the asset. At consistent demand if the supply reduces, the asset’s price climbs. This has been observed in Bitcoin and Litecoin.
Ripple price slips through critical support levels
Ripple (XRP) price is heading south as investors continue to cash in on the July 13 gains. This load-shedding exercise comes as the BTC price slump continues to harm altcoins. After flipping the 50-day EMA support at $0.6238 to resistance, XRP now faces the 100-day EMA at $0.5682. Failure of this buyer congestion level to hold could expose the remittance token to further decline, potentially reaching the 200-day EMA at $0.5158.
In a dire case, Ripple price could write off all the ground covered, extending to the $0.4191 support level. Such a move would constitute a 30% price drop below current price levels.
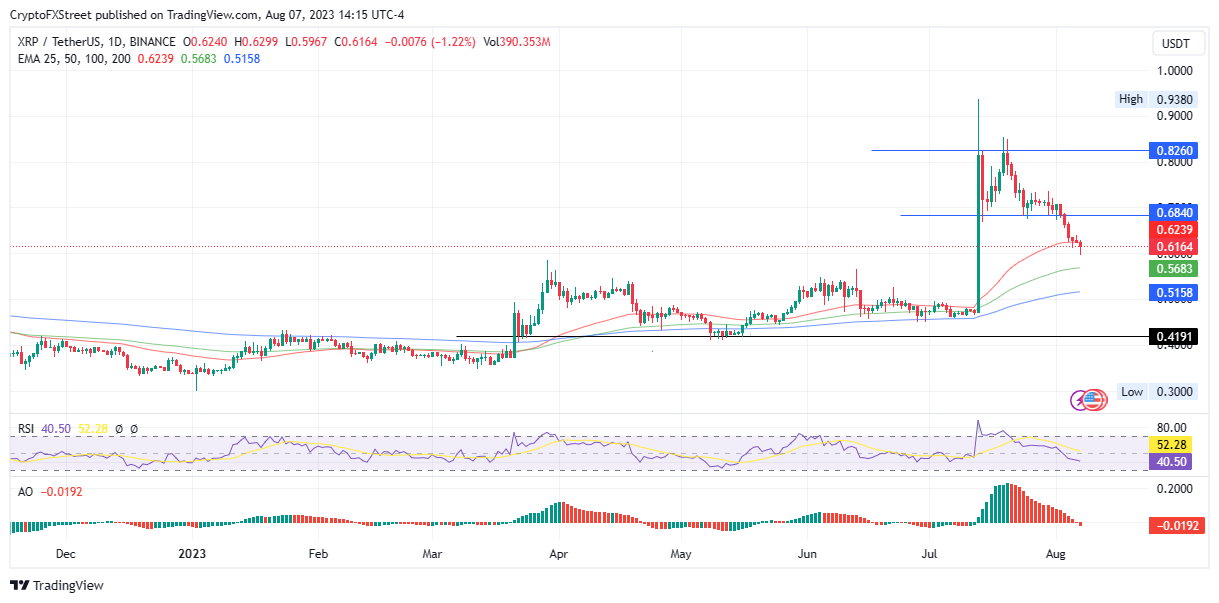
XRP/USDT 1-day chart
On the flip side, increased buyer momentum could restore Ripple price back above the 50-day EMA at $0.6238. In a highly ambitious case, the subsequent bullish push could propel XRP above the $0.6840 or $0.8260.
Also Read: Ripple XRP price on track to run up to $10 bullish target after one final shakeout.
Cryptocurrency metrics FAQs
What is circulating supply?
The developer or creator of each cryptocurrency decides on the total number of tokens that can be minted or issued. Only a certain number of these assets can be minted by mining, staking or other mechanisms. This is defined by the algorithm of the underlying blockchain technology. Since its inception, a total of 19,445,656 BTCs have been mined, which is the circulating supply of Bitcoin. On the other hand, circulating supply can also be decreased via actions such as burning tokens, or mistakenly sending assets to addresses of other incompatible blockchains.
What is market capitalization?
Market capitalization is the result of multiplying the circulating supply of a certain asset by the asset’s current market value. For Bitcoin, the market capitalization at the beginning of August 2023 is above $570 billion, which is the result of the more than 19 million BTC in circulation multiplied by the Bitcoin price around $29,600.
What is trading volume?
Trading volume refers to the total number of tokens for a specific asset that has been transacted or exchanged between buyers and sellers within set trading hours, for example, 24 hours. It is used to gauge market sentiment, this metric combines all volumes on centralized exchanges and decentralized exchanges. Increasing trading volume often denotes the demand for a certain asset as more people are buying and selling the cryptocurrency.
What is funding rate?
Funding rates are a concept designed to encourage traders to take positions and ensure perpetual contract prices match spot markets. It defines a mechanism by exchanges to ensure that future prices and index prices periodic payments regularly converge. When the funding rate is positive, the price of the perpetual contract is higher than the mark price. This means traders who are bullish and have opened long positions pay traders who are in short positions. On the other hand, a negative funding rate means perpetual prices are below the mark price, and hence traders with short positions pay traders who have opened long positions.
Author

Lockridge Okoth
FXStreet
Lockridge is a believer in the transformative power of crypto and the blockchain industry.


