Top 3 Price Prediction Bitcoin, Ethereum, Ripple: Penultimate moves for BTC, ETH as volatility grows for XRP
- Bitcoin price is bearishly heading into the weekend and could break below the $29,182 support level as volatility wanes.
- Ethereum price downtrend could continue amid falling momentum and the aura of a bearish BTC.
- Ripple price eyes further break down as bears capitalize on increasing volatility to seize the market.

Bitcoin price is trading with a bearish bias on the 15-minute timeframe, an outlook that has been mimicked by both Ethereum (ETH) and Ripple (XRP) price as crypto markets slide into the weekend with modesty and calm. Accordingly, experts do not expect any quick movements for the next couple of days, even as triangles form on intraday charts.
Bitcoin price slides into the weekend with calm
Bitcoin (BTC) price is testing the lower boundary of a triangle pattern forming on the 15-minute chart, with an overall bearish outlook after flipping the 200-, 100- and 50-day Exponential Moving Averages (EMA) at $29,224, $29,218, and $9,223 levels respectively from a support to a resistance level.
As the weekend settles in, Bitcoin price may not record a striking move, as is characteristic of weekend volatility, except for the current bearish pull that continues to force BTC southward. The Relative Strength Index (RSI) is heading south as the histograms of the Awesome Oscillators also drop, suggesting falling momentum.
An increase in selling pressure could see Bitcoin price test the early August lows at around $29,038 to collect liquidity before a possible uptrend.
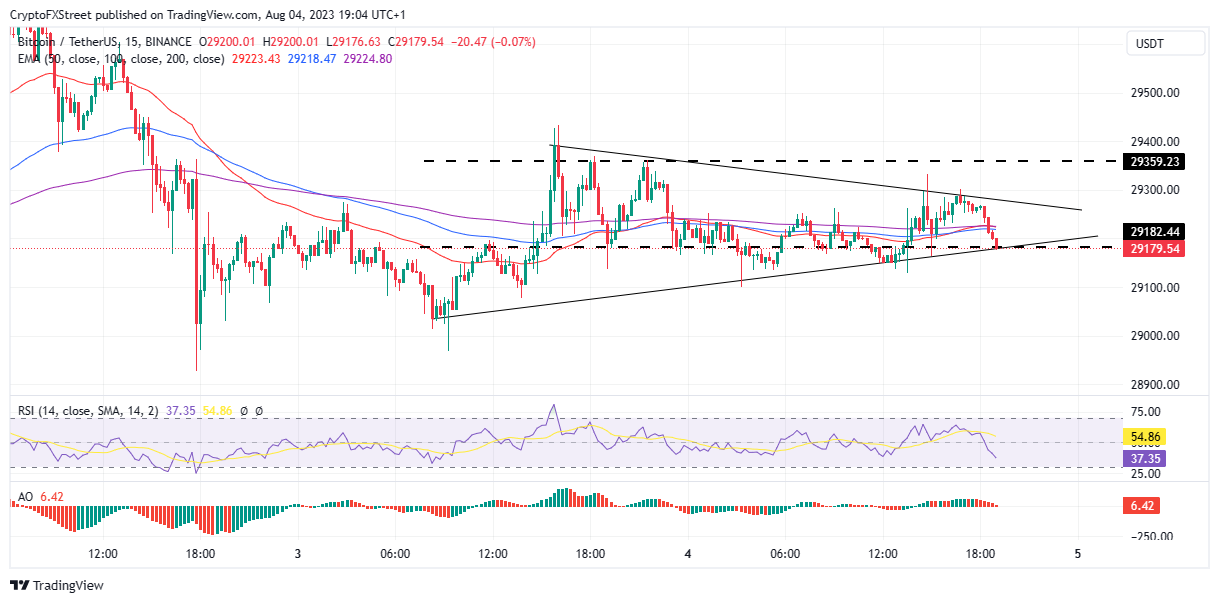
BTC/USDT 15-min chart
Conversely, an increase in buying pressure above current levels could see Bitcoin price bounce north, first shattering past the resistance confluence between the three EMAs before a possible tag of the upper boundary of the technical formation. However, for a confirmed uptrend, Bitcoin price must record a decisive 15-minute candlestick close above $29,359.
Also Read: Bitcoin price holds above $29,000 after below-expectations US NFP data.
Ethereum price mimics BTC
Ethereum (ETH) price is following on the heels of BTC, heading south in the 15-minute timeframe with its price action consolidating into a triangle. Noteworthy, such technical formations are often penultimate (second from last) and moving in a trend. In the case of BTC and ET, the overall trend is a bearish correction that began after the July peak.
As momentum continues to fall, indicated by the southbound RSI and the reducing AO histograms, the bearish grip for Ethereum price could increase, sending the PoS token lower, potentially breaching the $1,836 support. In the dire case, ETH could extend lower to find support at around the $1,831 support level. This would be the most likely turnaround point for ETH.
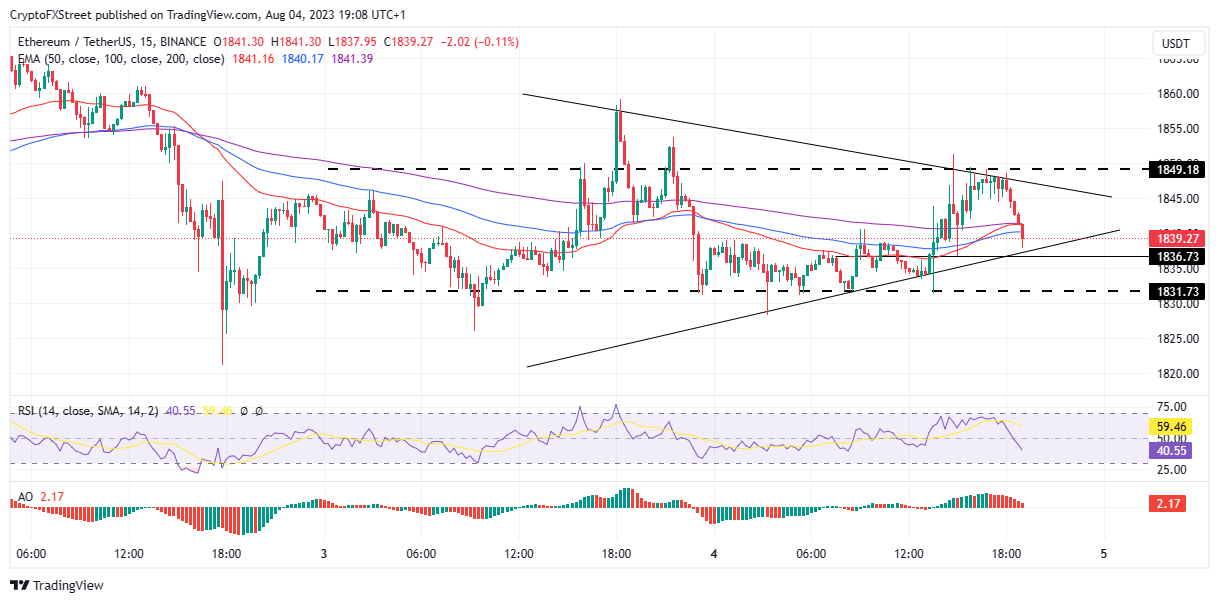
ETH/USDT 15-min chart
Conversely, a resurgence by bulls could see Ethereum price bounce from the lower trendline of the triangle and head north to flip the three EMAs back to support. However, the gloomy outlook would only be invalidated upon a strong move above the $1,849 resistance level.
Also Read: Ether ETF applications flood the SEC as ProShares files the 11th
Ripple price volatility increases
Ripple (XRP) price is also sliding, with an overall bearish outlook that could extend if bulls continue sitting on their hands. As overhead pressure continues to build, XRP could soon breach the immediate support at $0.657 to collect the liquidity underneath.
This liquidity could help stabilize the market and give bulls a possible reentry point, but delayed entry could see Ripple price extend further south before finding a turnaround point. Noteworthy, as XRP heads south, it continuously writes off the July 13 gains.

XRP/USDT 15-min chart
If sidelined and late investors come in, Ripple price could be headed north, with a successful escape from the foothold of the 50-,100-, and 200-day EMA at $0.663, $0.665, and $0.671, respectively, confirming the uptrend.
Also Read: Ripple plan to re-engage with US market could trigger XRP price recovery.
Cryptocurrency prices FAQs
How do new token launches or listings affect cryptocurrency prices?
Token launches like Arbitrum’s ARB airdrop and Optimism OP influence demand and adoption among market participants. Listings on crypto exchanges deepen the liquidity for an asset and add new participants to an asset’s network. This is typically bullish for a digital asset.
How do hacks affect cryptocurrency prices?
A hack is an event in which an attacker captures a large volume of the asset from a DeFi bridge or hot wallet of an exchange or any other crypto platform via exploits, bugs or other methods. The exploiter then transfers these tokens out of the exchange platforms to ultimately sell or swap the assets for other cryptocurrencies or stablecoins. Such events often involve an en masse panic triggering a sell-off in the affected assets.
How do macroeconomic releases and events affect cryptocurrency prices?
Macroeconomic events like the US Federal Reserve’s decision on interest rates influence risk assets like Bitcoin, mainly through the direct impact they have on the US Dollar. An increase in interest rate typically negatively influences Bitcoin and altcoin prices, and vice versa. If the US Dollar index declines, risk assets and associated leverage for trading gets cheaper, in turn driving crypto prices higher.
How do major crypto upgrades like halvings, hard forks affect cryptocurrency prices?
Halvings are typically considered bullish events as they slash the block reward in half for miners, constricting the supply of the asset. At consistent demand if the supply reduces, the asset’s price climbs. This has been observed in Bitcoin and Litecoin.
Author

Lockridge Okoth
FXStreet
Lockridge is a believer in the transformative power of crypto and the blockchain industry.