Bitcoin’s quarterly chart simplifies confusion, 15% crash likely before $40,000, $50,000 or new all-time high
- Bitcoin price could crash anywhere from 15% to 26%, as seen on a three-month chart.
- Two out of three inefficiencies have been balanced almost completely, further adding credence to the bearish outlook.
- If this seller-favored scenario plays out, BTC could retest $24,777 and $21,473 levels.
- From a long-term holder perspective, the aforementioned levels are perfect buying opportunities.

Bitcoin price could have formed a potential local top in the second quarter, putting an end to the 2023 rally. After a mere 7.05% return in the second quarter, BTC has flipped negative with a -4.52% performance. As suggested by historical data, the third quarter is relatively bearish and would provide opportunities for long-term holders to accumulate.
Read more: Will altcoin investments pay out in third quarter of 2023?
Bitcoin, altcoins, stablecoins FAQs
What is Bitcoin?
Bitcoin is the largest cryptocurrency by market capitalization, a virtual currency designed to serve as money. This form of payment cannot be controlled by any one person, group, or entity, which eliminates the need for third-party participation during financial transactions.
What are altcoins?
Altcoins are any cryptocurrency apart from Bitcoin, but some also regard Ethereum as a non-altcoin because it is from these two cryptocurrencies that forking happens. If this is true, then Litecoin is the first altcoin, forked from the Bitcoin protocol and, therefore, an “improved” version of it.
What are stablecoins?
Stablecoins are cryptocurrencies designed to have a stable price, with their value backed by a reserve of the asset it represents. To achieve this, the value of any one stablecoin is pegged to a commodity or financial instrument, such as the US Dollar (USD), with its supply regulated by an algorithm or demand. The main goal of stablecoins is to provide an on/off-ramp for investors willing to trade and invest in cryptocurrencies. Stablecoins also allow investors to store value since cryptocurrencies, in general, are subject to volatility.
What is Bitcoin Dominance?
Bitcoin dominance is the ratio of Bitcoin's market capitalization to the total market capitalization of all cryptocurrencies combined. It provides a clear picture of Bitcoin’s interest among investors. A high BTC dominance typically happens before and during a bull run, in which investors resort to investing in relatively stable and high market capitalization cryptocurrency like Bitcoin. A drop in BTC dominance usually means that investors are moving their capital and/or profits to altcoins in a quest for higher returns, which usually triggers an explosion of altcoin rallies.
Bitcoin price on the lookout for a foothold
Bitcoin price returned 7.05% in the second quarter producing a local top at $31,500. This high was quickly swept for buy-side liquidity, signaling a potential trend reversal. Rightfully so, BTC has slid 8.70% from this top and currently trades at $29,078.
A quick look at the three-month Bitcoin price chart shows that the 2023 rally was initially aimed at rebalancing the inefficiency produced in the second quarter of 2022, extending from $25,200 to $32,853. The inefficient structure termed Fair Value Gap (FVG) is formed when there is an imbalance in the order flow, i.e., dominated by buyers or sellers.
From the start of 2023 to sweeping the second quarter higher, Bitcoin price has all but rebalanced the said 2022 inefficiency and now looks to do the same with the rest of the FVGs. The 93% rally that was responsible for filling up the 2022 FVG created another imbalance, extending from $24,777 to $21,473.
Read more: Bitcoin Weekly Forecast: Can BTC reach $40k or $25k first?
Hence, a drop in Bitcoin price is logical, considering that BTC has not only rebalanced the FVG to the upside but also collected the buy-stop liquidity. Hence, the only remaining direction for BTC to head would be south. In such a case, a 15% to 26% drop is likely for the pioneer crypto.
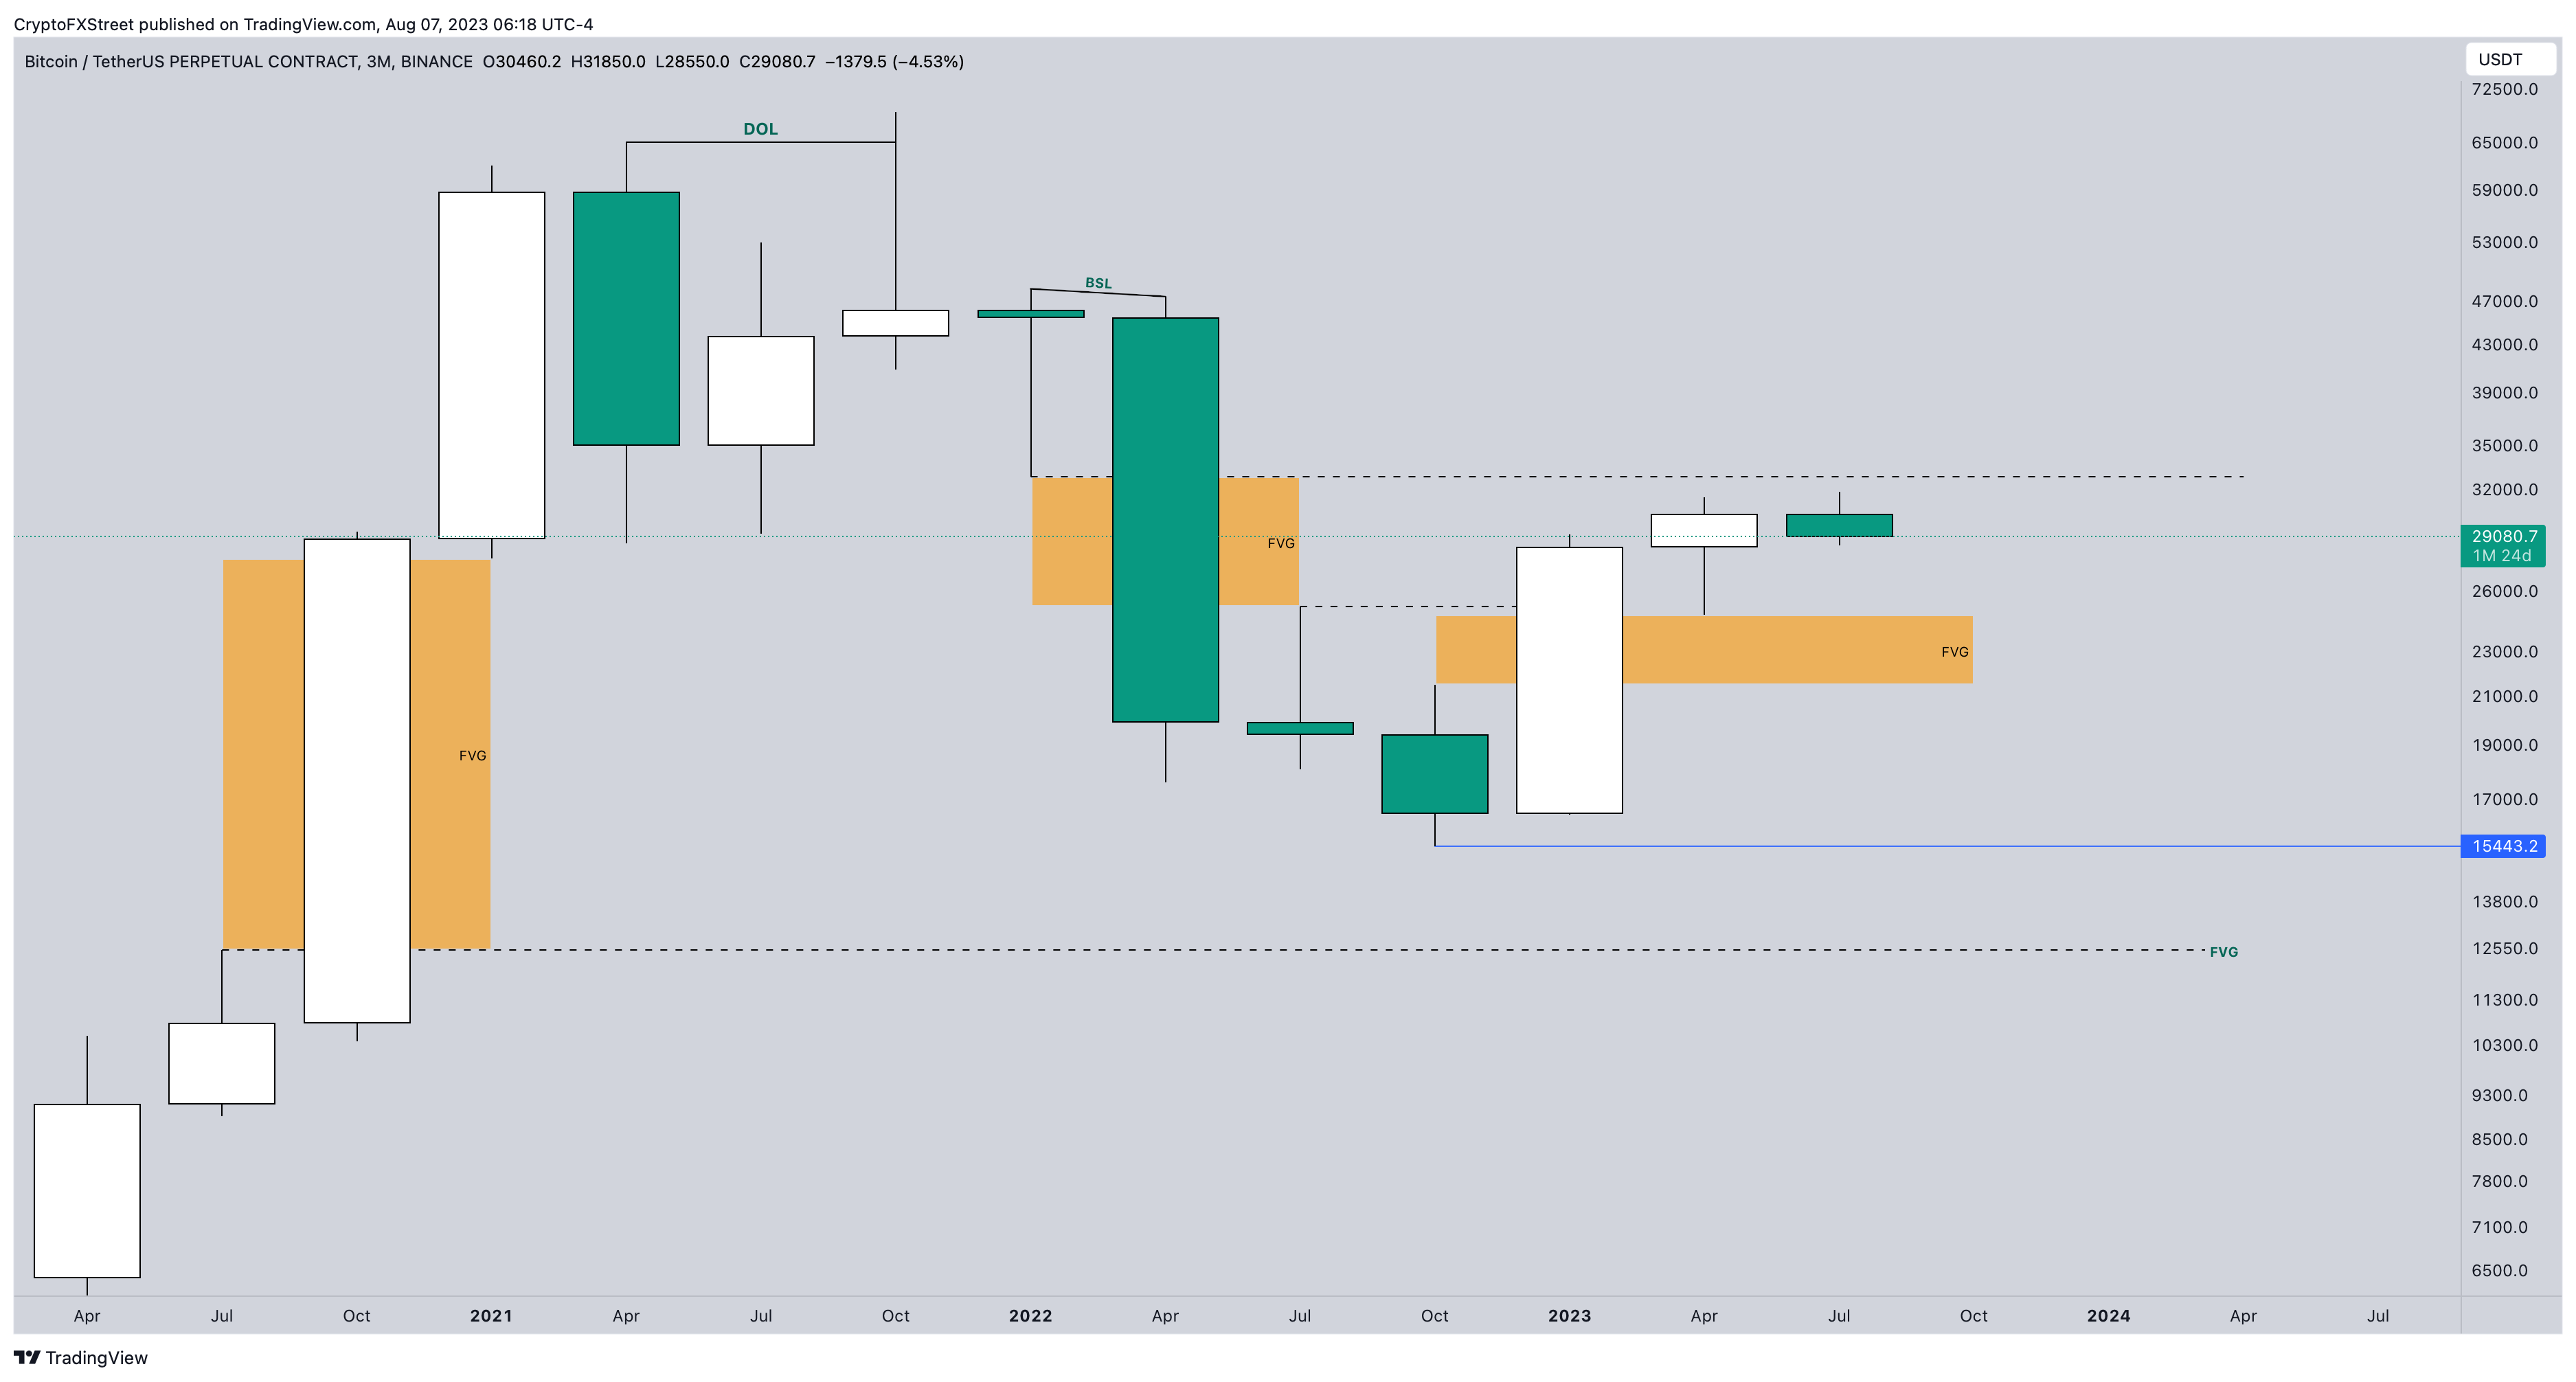
BTC/USDT 3-month chart
While the short-term correction, ranging from 15% to 26%, might seem a lot, it would be a buying opportunity for long-term holders. But a breakdown of the $15,443 swing low would invalidate the bullish thesis by producing a lower low. Such a development would also invalidate the bullish thesis and potentially trigger a correction to $13,000 and $11,898 levels.
The short-term bearish outlook will also go kaput if Bitcoin price extends its 2023 bull rally and sweeps the buy-side liquidity resting above $47,448 and $48,200.
Like this article? Help us with some feedback by answering this survey:
Author

Akash Girimath
FXStreet
Akash Girimath is a Mechanical Engineer interested in the chaos of the financial markets. Trying to make sense of this convoluted yet fascinating space, he switched his engineering job to become a crypto reporter and analyst.


