Top 3 Price Prediction Bitcoin, Ethereum, Ripple: A smaller time frame narrative
- Bitcoin price shows bearish divergences between uptrend moves this week.
- Ethereum price may be setting up for a decline toward $1,100.
- XRP price hovers near several indicators in a congestive manner.

The crypto market remains stagnant during the second trading week of December. Following the Producer Price Index data release, the market shows sparse signals to justify entering a confident trade. Traders may want to remain sidelined until a definitive trend is established. This thesis remains neutral but identifies bullish and bearish scenarios for Bitcoin, Ethereum and the XRP price.
Bitcoin price shows divergence
Bitcoin price has forced traders to diver into smaller time frames to interpret where the peer-to-peer digital currency may be headed next. On the 2-hour chart, The November 8 upswing back over the $17,000 barrier breached oversold conditions on the Relative Strength Index (RS). The RSI is an indicator used to assess the strength and intentions of market participants.
The RSI’s breach into oversold territories is a good sign as it implies bulls are still interested in taking a risk in the market. Still, it should be noted that there is a bearish divergence between recent swings. The Monday high at $17,424.95 is displayed as a weaker uptrend move on the RSI compared to the recent Friday high at $17,199.
Bearish divergences are often the catalyst for market reversals. If the market is genuinely bearish, a breach below the 8-day exponential moving average at 17,010 could induce a decline into the $16,200 support zone, resulting in a 5% decline.
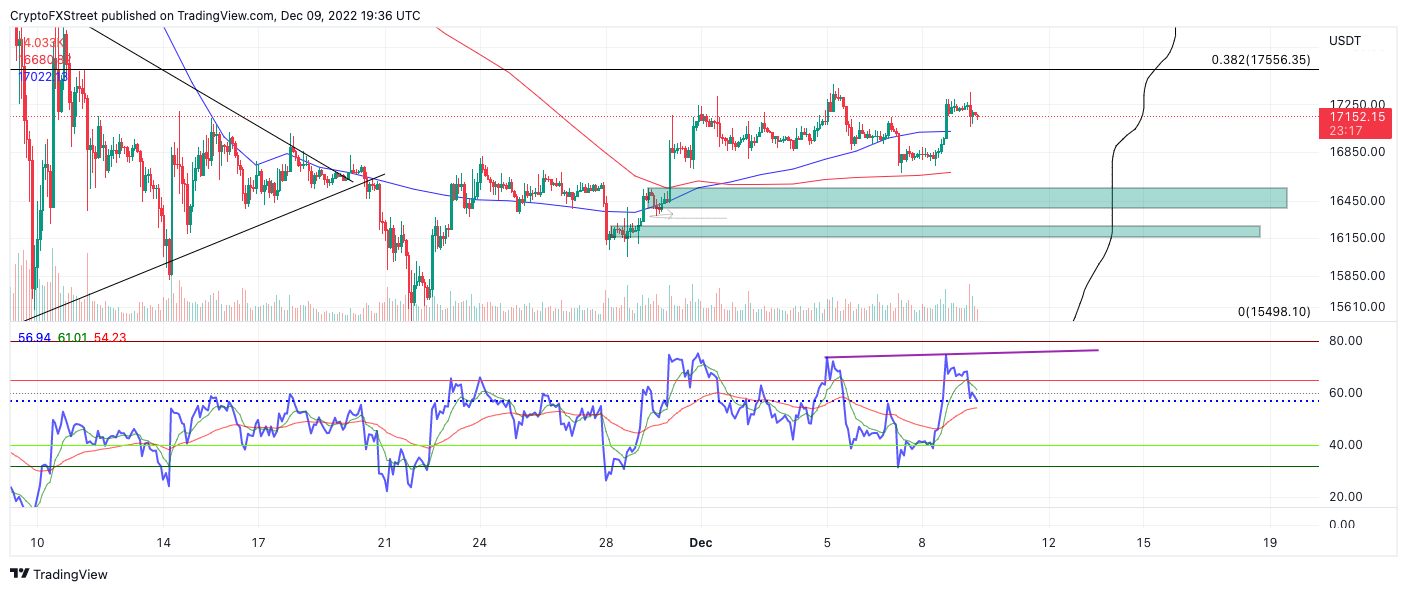
BTC/USDT 2-Hour Chart
On the contrary, if the market finds support from the 8-day EMA, a second attempt at the divergent highs could induce a rally toward the $17,555 and $18,245 price zones. The target zones are extracted from A Fibonacci retracement tool surrounding the entirety of November’s downtrend.
Ethereum price has a decision to make
Ethereum price currently auctions at $1,272 as the bulls and bears are wrestling within a coiling congestion zone. Several bearish divergences have been spotted on the Relative Strength Index, with traders eyeing the possibility for a short.
At the time of writing, the bulls maintain support above the 8-day exponential moving average on smaller time frames. A 4-hour candlestick close beneath the aforementioned indicator would induce a decline towards the 21-day simple moving average at $1,220, resulting in a 4% decline. If the market is genuinely bearish, the bulls should not retest the divergent highs near the $1,300 level.
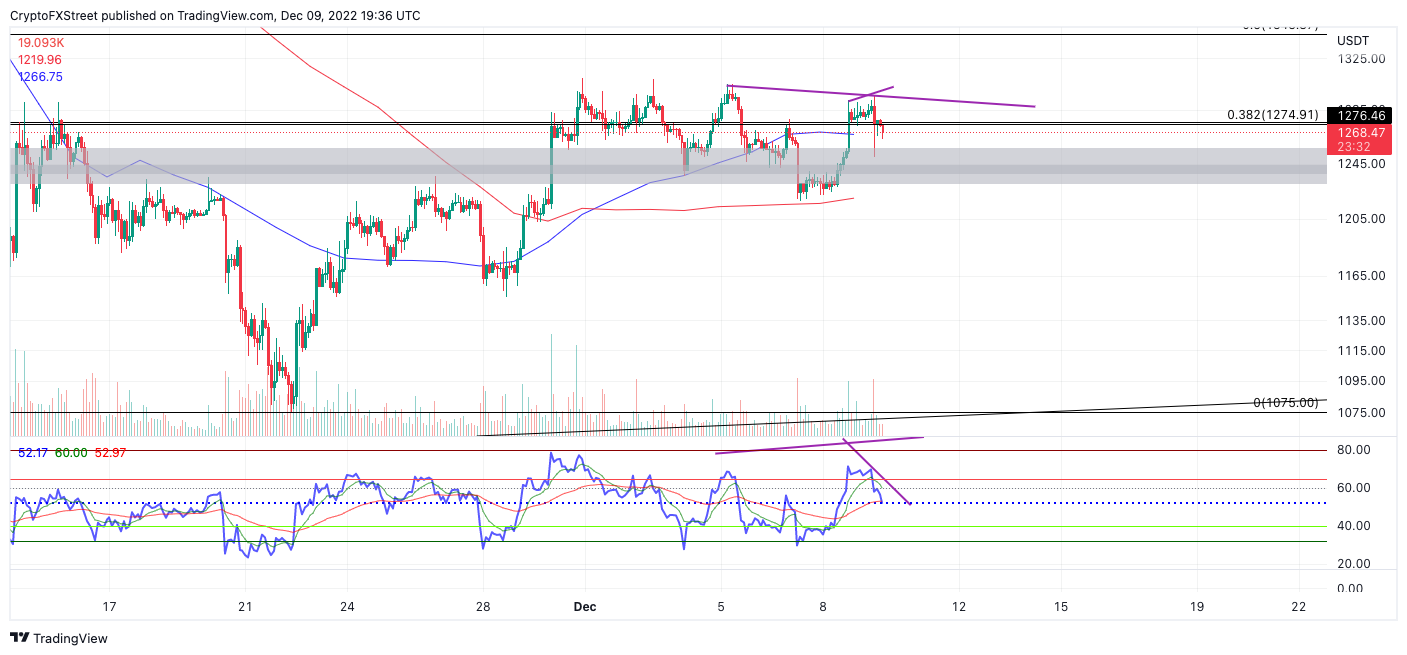
ETH/USDT 1-Hour Chart
To play devil's advocate, a breach above $1,300 would induce an upswing towards $1,343 and potentially $1,400. Like Bitcoin, the bullish target zones are established utilizing a Fibonacci retracement tool surrounding the November swing high to swing low.
XRP price continues to ricochet
XRP price has ascended in a turbulent fashion. Since mid-November, the digital remittance token rallied 30% and has endured sideways price action throughout December near the $0.39 barrier.
The XRP price is in a peculiar situation. The bears have successfully breached the trendline which guided Ripple’s 30% rally. However, the bulls are still maintaining support above the descending trendline that rejected the bulls' attempt for higher gains during the same period.
Adding more fuel to the confusing price action, the 8-day exponential and 21-day simple moving averages are converging above the current auctioning price. If market conditions persist, a bearish cross will likely occur in the coming hours. A bearish cross is when the faster-moving average crosses over, the slower-moving average, while a digital asset's price hangs out below both indicators. Bearish crosses are usually the catalyst for very sudden price drops.
A breach of the December 7 low at $0.373 could be the signal that sidelined bears are waiting for short the XRP price. The bearish targets lie near the origin point of November’s 30% rally of $0.31. If the bearish scenario played out, the XRP price would decline by 17%.
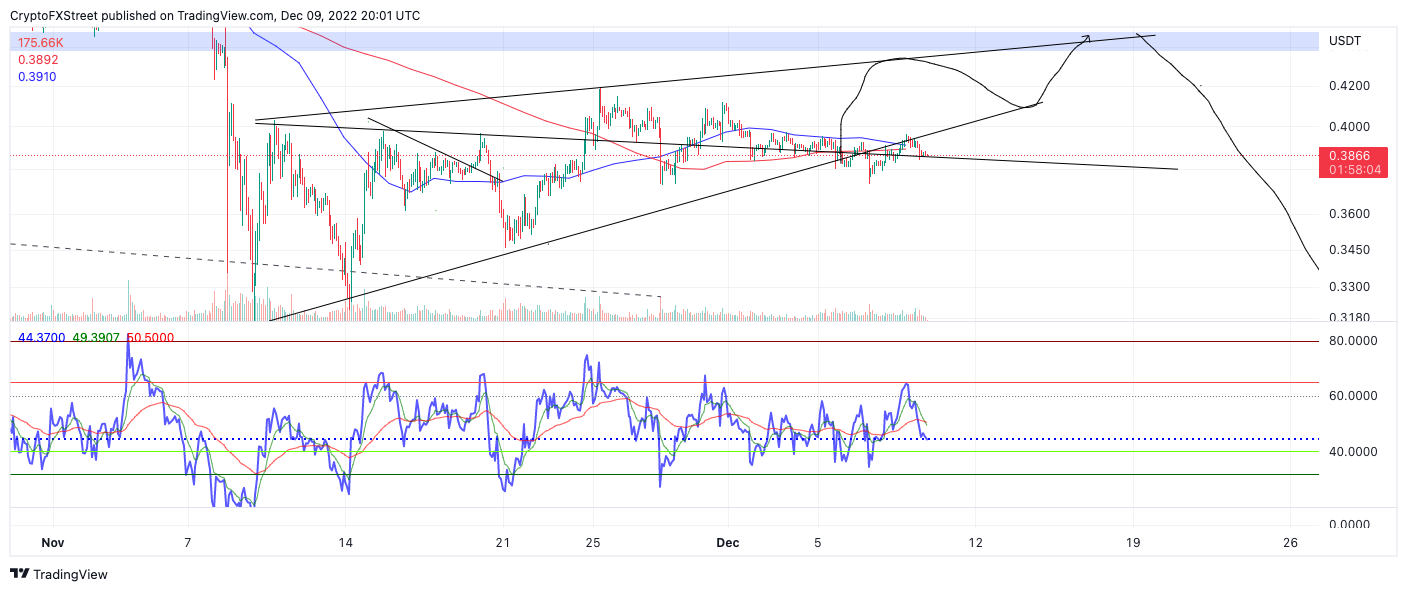
XRP/USDT 2-Hour Chart
If the bulls defend their grounds, a successful hurdle above the psychological $0.40 level could prompt a rally into October's broken support zone near $0.44. Such a move would result in a 13% increase from the current XRP price.
Author

Tony M.
FXStreet Contributor
Tony Montpeirous began investing in cryptocurrencies in 2017. His trading style incorporates Elliot Wave, Auction Market Theory, Fibonacci and price action as the cornerstone of his technical analysis.