Top 3 Price Prediction Bitcoin, Ethereum, Ripple: Forecasting gains vs. pain in December
- Bitcoin price hovers above a previous congestion zone and has the potential to continue higher.
- Ethereum price auctions below a broken level of support and presents a risky trade.
- XRP price has ambitious short-term technicals that target October's trading range.

The crypto market consolidates after a month of negative returns. While many investors are hoping for a Santa Rally, the technicals show the long-term potential for more down-trending price action. Still, this thesis maintains a neutral stance and outlines potential moves for bulls and bears in the market.
Bitcoin price has room to tread higher
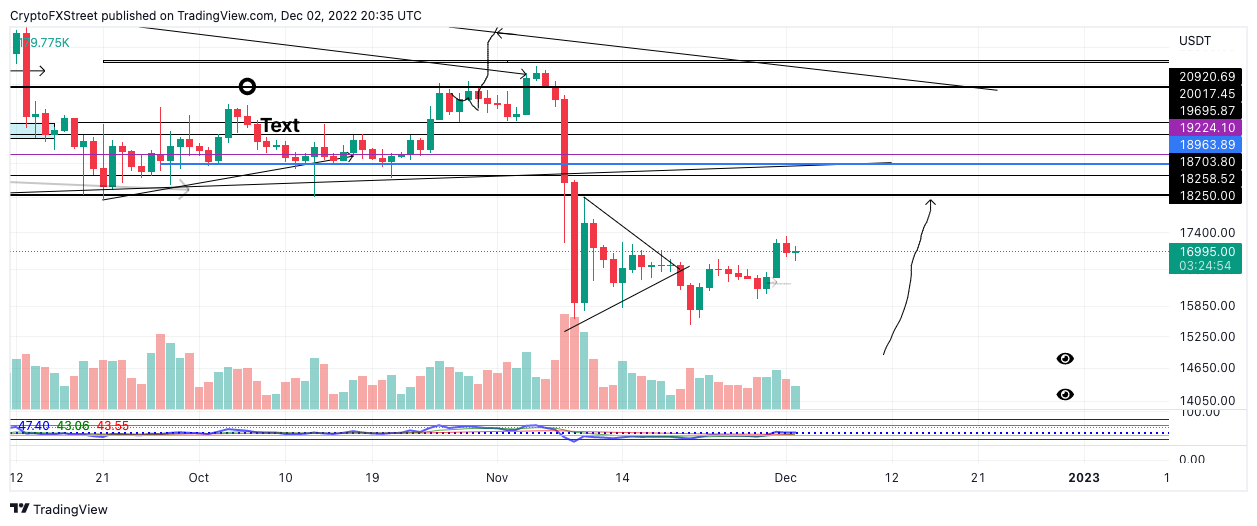
Bitcoin price currently trades at $16,945. The bulls have produced a daily closing candle stick back into November's trading range. Still, investors should remember November's monthly candlestick closed bearish 16% below the opening price at $17,163.64
At the time of writing, the bulls do have the potential to rally higher, but resistance will likely kick in near the broken support levels near $18,250 levels. The uptrend scenario is thus capped at a 9% increase from the current market value. A weekly close above the aforementioned level is needed to forecast higher targets.
The countertrend hike towards $18,205 remains in play so long as the BTC price can sustain itself above the previous congestion zone's midpoint at $16,660. A breach of the level could lead to a submergence-back-in-the-range scenario. BTC could fall another 13% as low as $14,900 if said price action were to occur.
BTC/USDT 1-day chart
Ethereum price retests broken support
Ethereum price has hurdled through the mid $1,200 zone on smaller time frames, enticing day traders to continue looking for countertrend scalps. Still, zooming out and analyzing the larger picture helps apply healthy risk management practices.
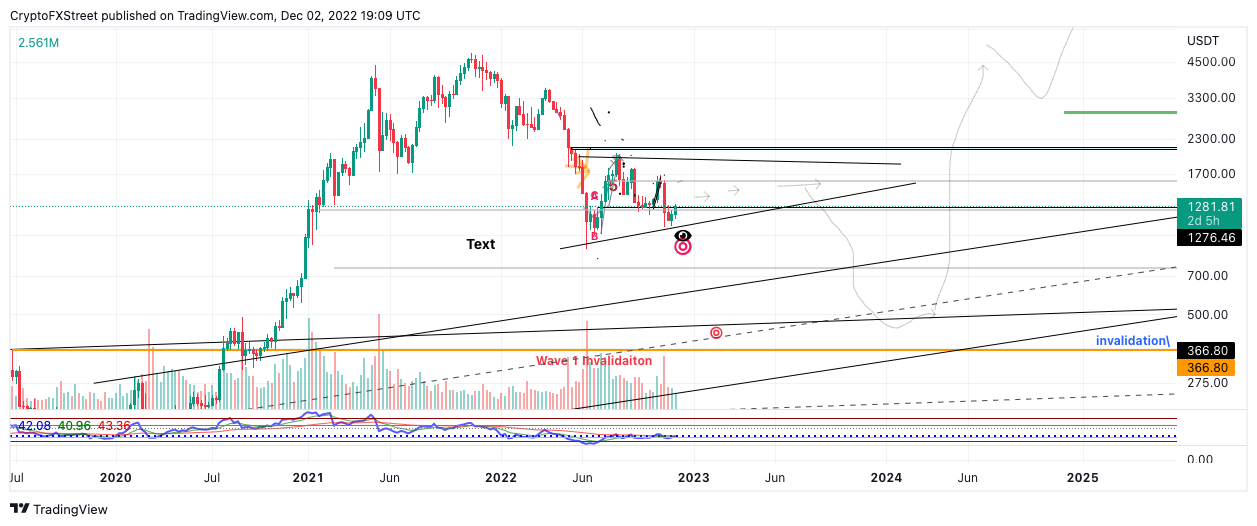
Ethereum price auctions at $1,282. The uptrend move from the November low puts 20% of the lost market value back into the hands of investors. However, ETH has yet to produce a weekly candlestick close inside or above the recently broken support zone at $1,250. Traders may recall the aforementioned level as it played a crucial role in October's 40% countertrend rally.
Traders may consider waiting for the weekly settlement before getting involved with the decentralized smart-contract token's price action. A weekly candlestick close above $1,270 would create the possibility of an additional uptrend hike near the northern side of the broken support zones' range at $1,580. ETH would rise by 25% under said price action.
ETH/USDT 4-Hour Chart
On the contrary, failure to settle above $1,270 will spell bad news in the short term. ETH could embark on a sweep-the-lows event targeting liquidity levels near the $1,000 price zone. The Ethereum price would subsequently fall 22% from the current market value.
XRP price shows ambition
XRP price hovers 5% below November's monthly settle at $0.407. As the price coils between the 8-day and 21-day simple moving averages, the next move is anyone's guess. While smaller timeframes have been bullish recently, traders should consider the larger narrative's technicals.
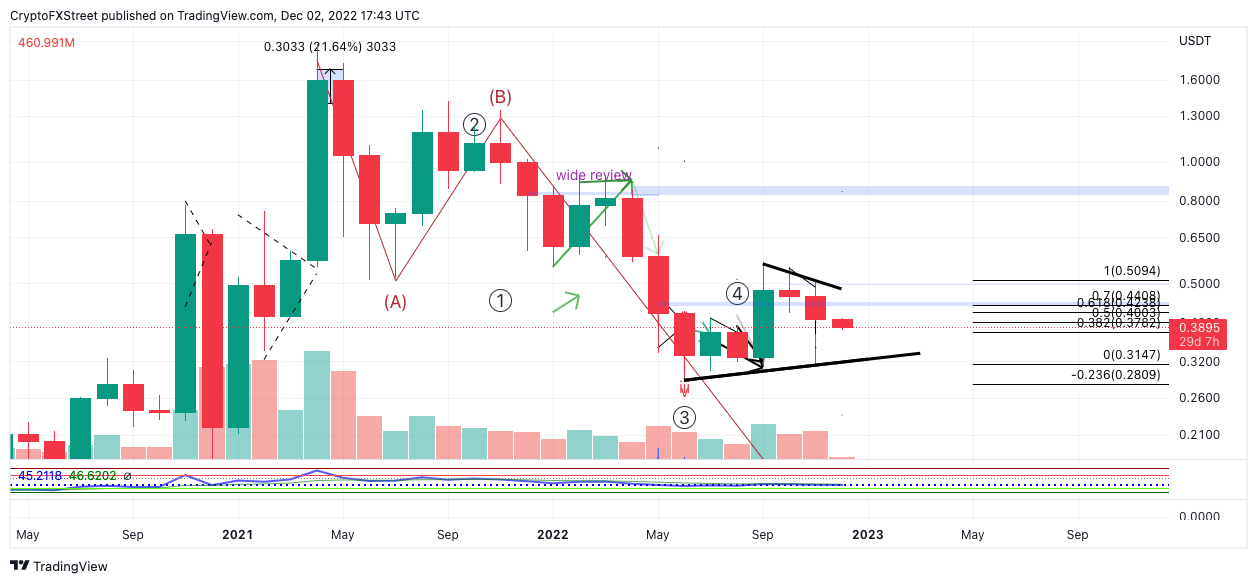
XRP price trades at $0.390 as the bulls near a descending trend line which acted as resistance throughout November. If the bulls can sustain themselves above the barrier, the XRP price will likely test the broken support zone at $0.44. The aforementioned level played a crucial role in XRP's ascension into the $.50 in November. The barrier has not been retested since the bearish penetration, which sent XRP to the November low at $0.31.
XRP/USDT 1-month chart
An additional spike through the 21-day simple moving average at $0.380 should be enough to invalidate the bullish outlook. If the breach occurs, the XRP price could fall into the other side of November's trading range, near $0.31. Such a move would result in an 18% increase from the current XRP price.
Author

Tony M.
FXStreet Contributor
Tony Montpeirous began investing in cryptocurrencies in 2017. His trading style incorporates Elliot Wave, Auction Market Theory, Fibonacci and price action as the cornerstone of his technical analysis.


