Top 3 Price Prediction Bitcoin, Ethereum, Ripple: Crypto vs. Inflation
- Bitcoin price prints a new high for December after rallying by 7% on the week.
- Ethereum price moved in unison with BTC and tagged a key level of interest.
- XRP price has stayed the same, which hints the digital remittance token may be decorrelating from the market.

The crypto market has shown strength following the US Consumer Price Index data release, which came in lower than expected. Key levels have been defined to gauge where bulls in the market may be aiming.
Bitcoin price fights back
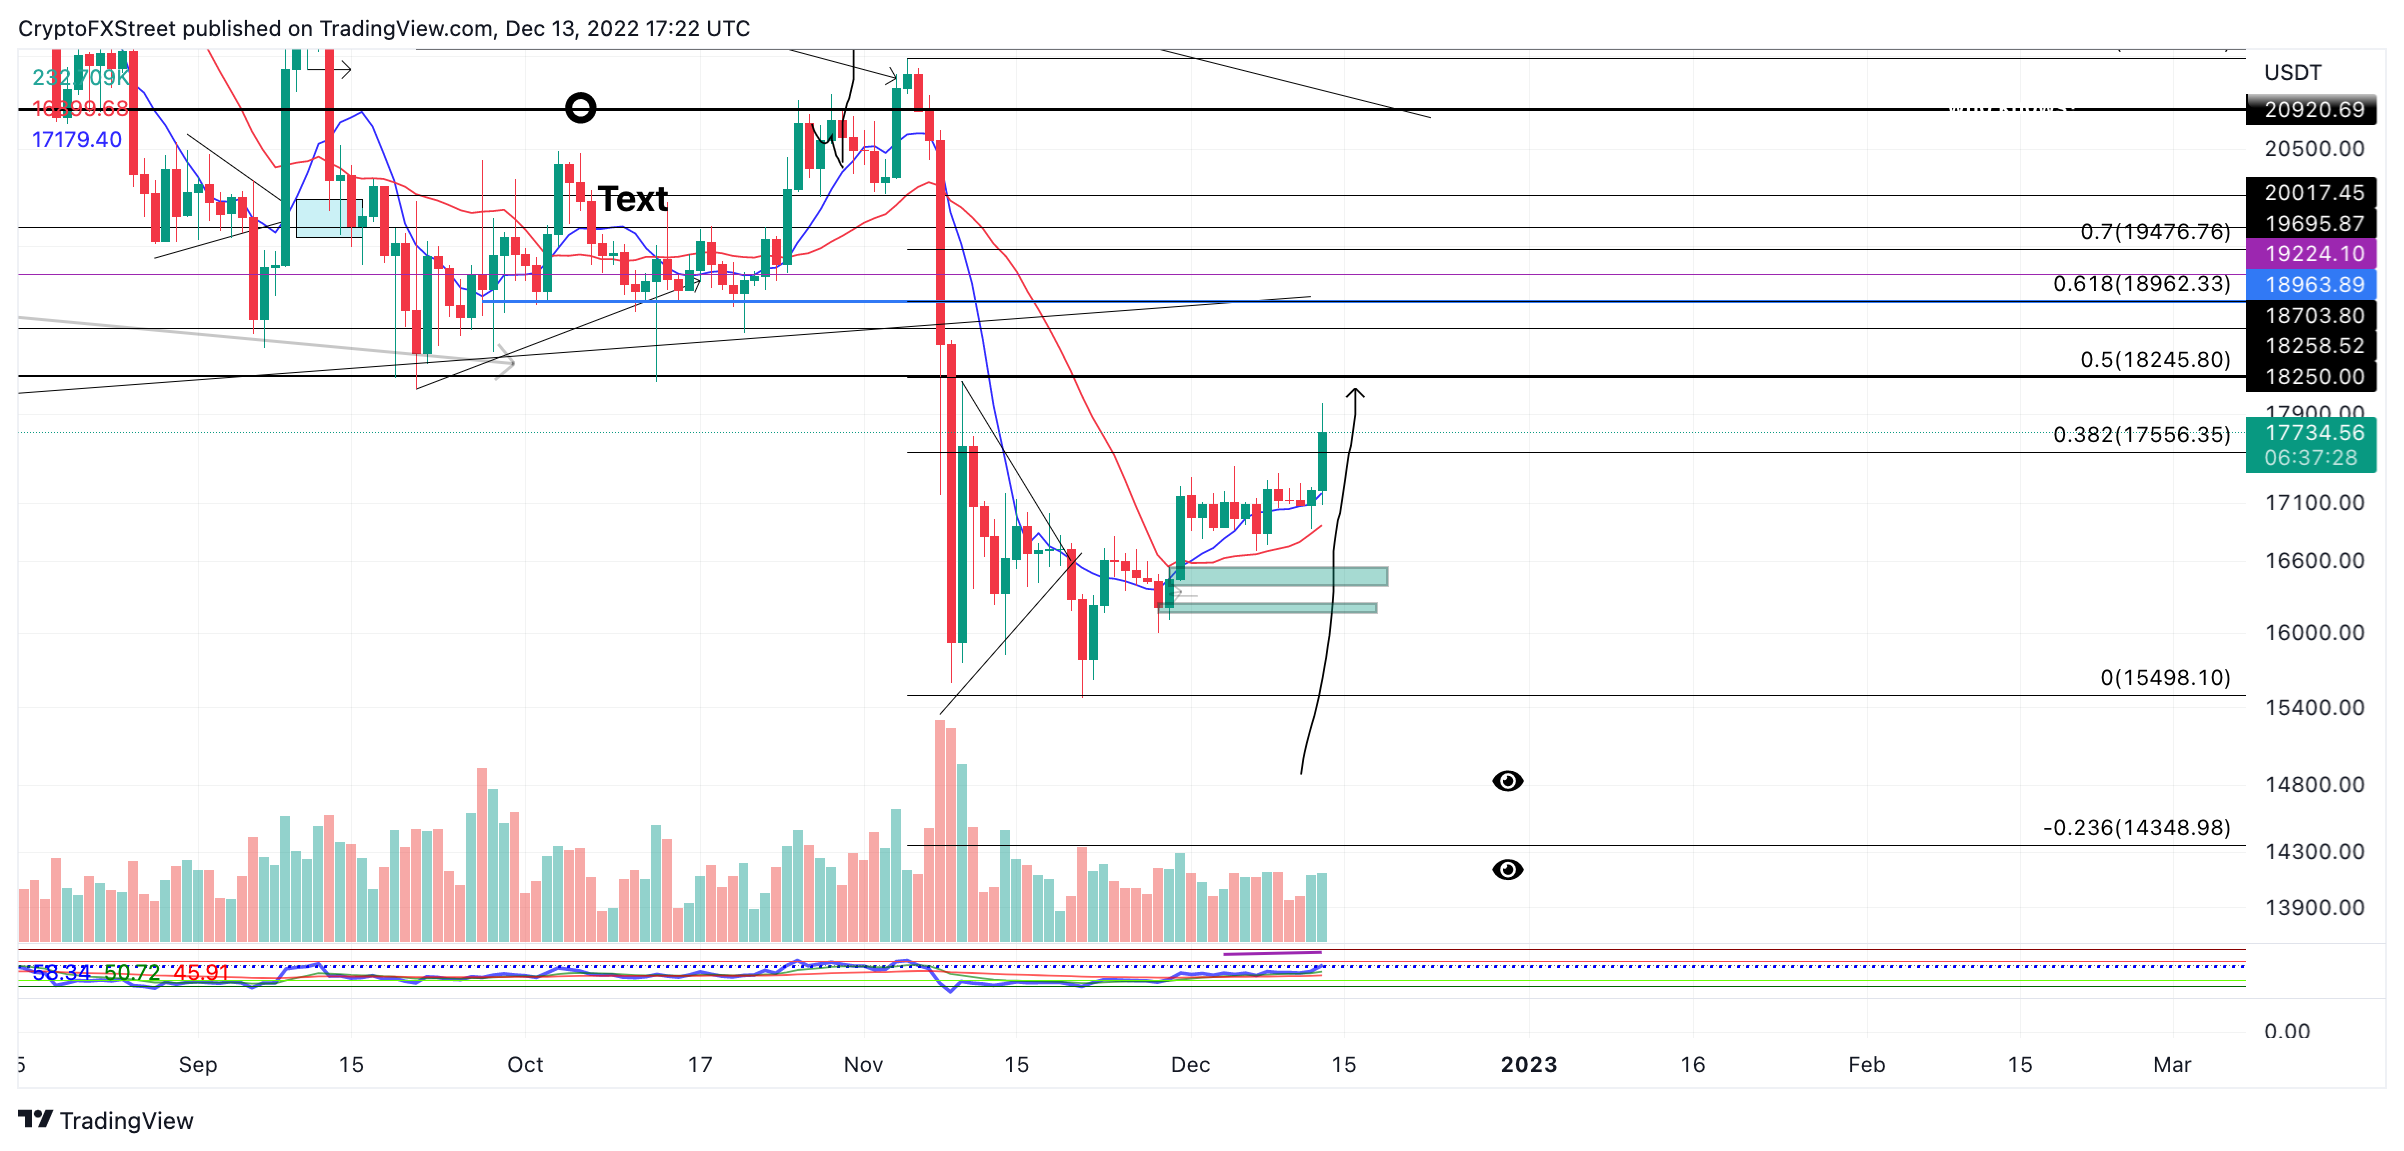
Bitcoin price has shown applaudable price action as the bulls have pulled off a 7% rally. On December 13, the peer-to-peer digital currency spiked to the $18,000 level after finding support from the 8-day exponential moving average. As a profit-taking consolidation occurs, traders are forced to consider the idea that the BTC rally will continue.
Bitcoin price currently auctions at $17,784. The rally is interesting as November's US Consumer Price Index (CPI) came in lower than expected. At 7.1% for November, the index read lower than October's 7.7%. The CPI is a metric used by the Federal Reserve to measure inflation. As a result of the downtick, risk-on assets like BTC have enticed investors to bid for short-term gains in anticipation of a Santa Rally.
BTC/USDT 1-Day Chart
If the market is genuinely bullish, the next target will be the 50% retracement level at $18,245 and the 61.8% Fib retracement level just below the psychological $19,000 level. The fib levels are based on November's swing high to swing low on the logarithmic scale.
The uptrend scenario will be void if the bears pierce through the previous congestion zone near $16,900. The bears could prompt a decline towards the yearly low at $15,476 if the bearish scenario occurred.
Ethereum price takes charge
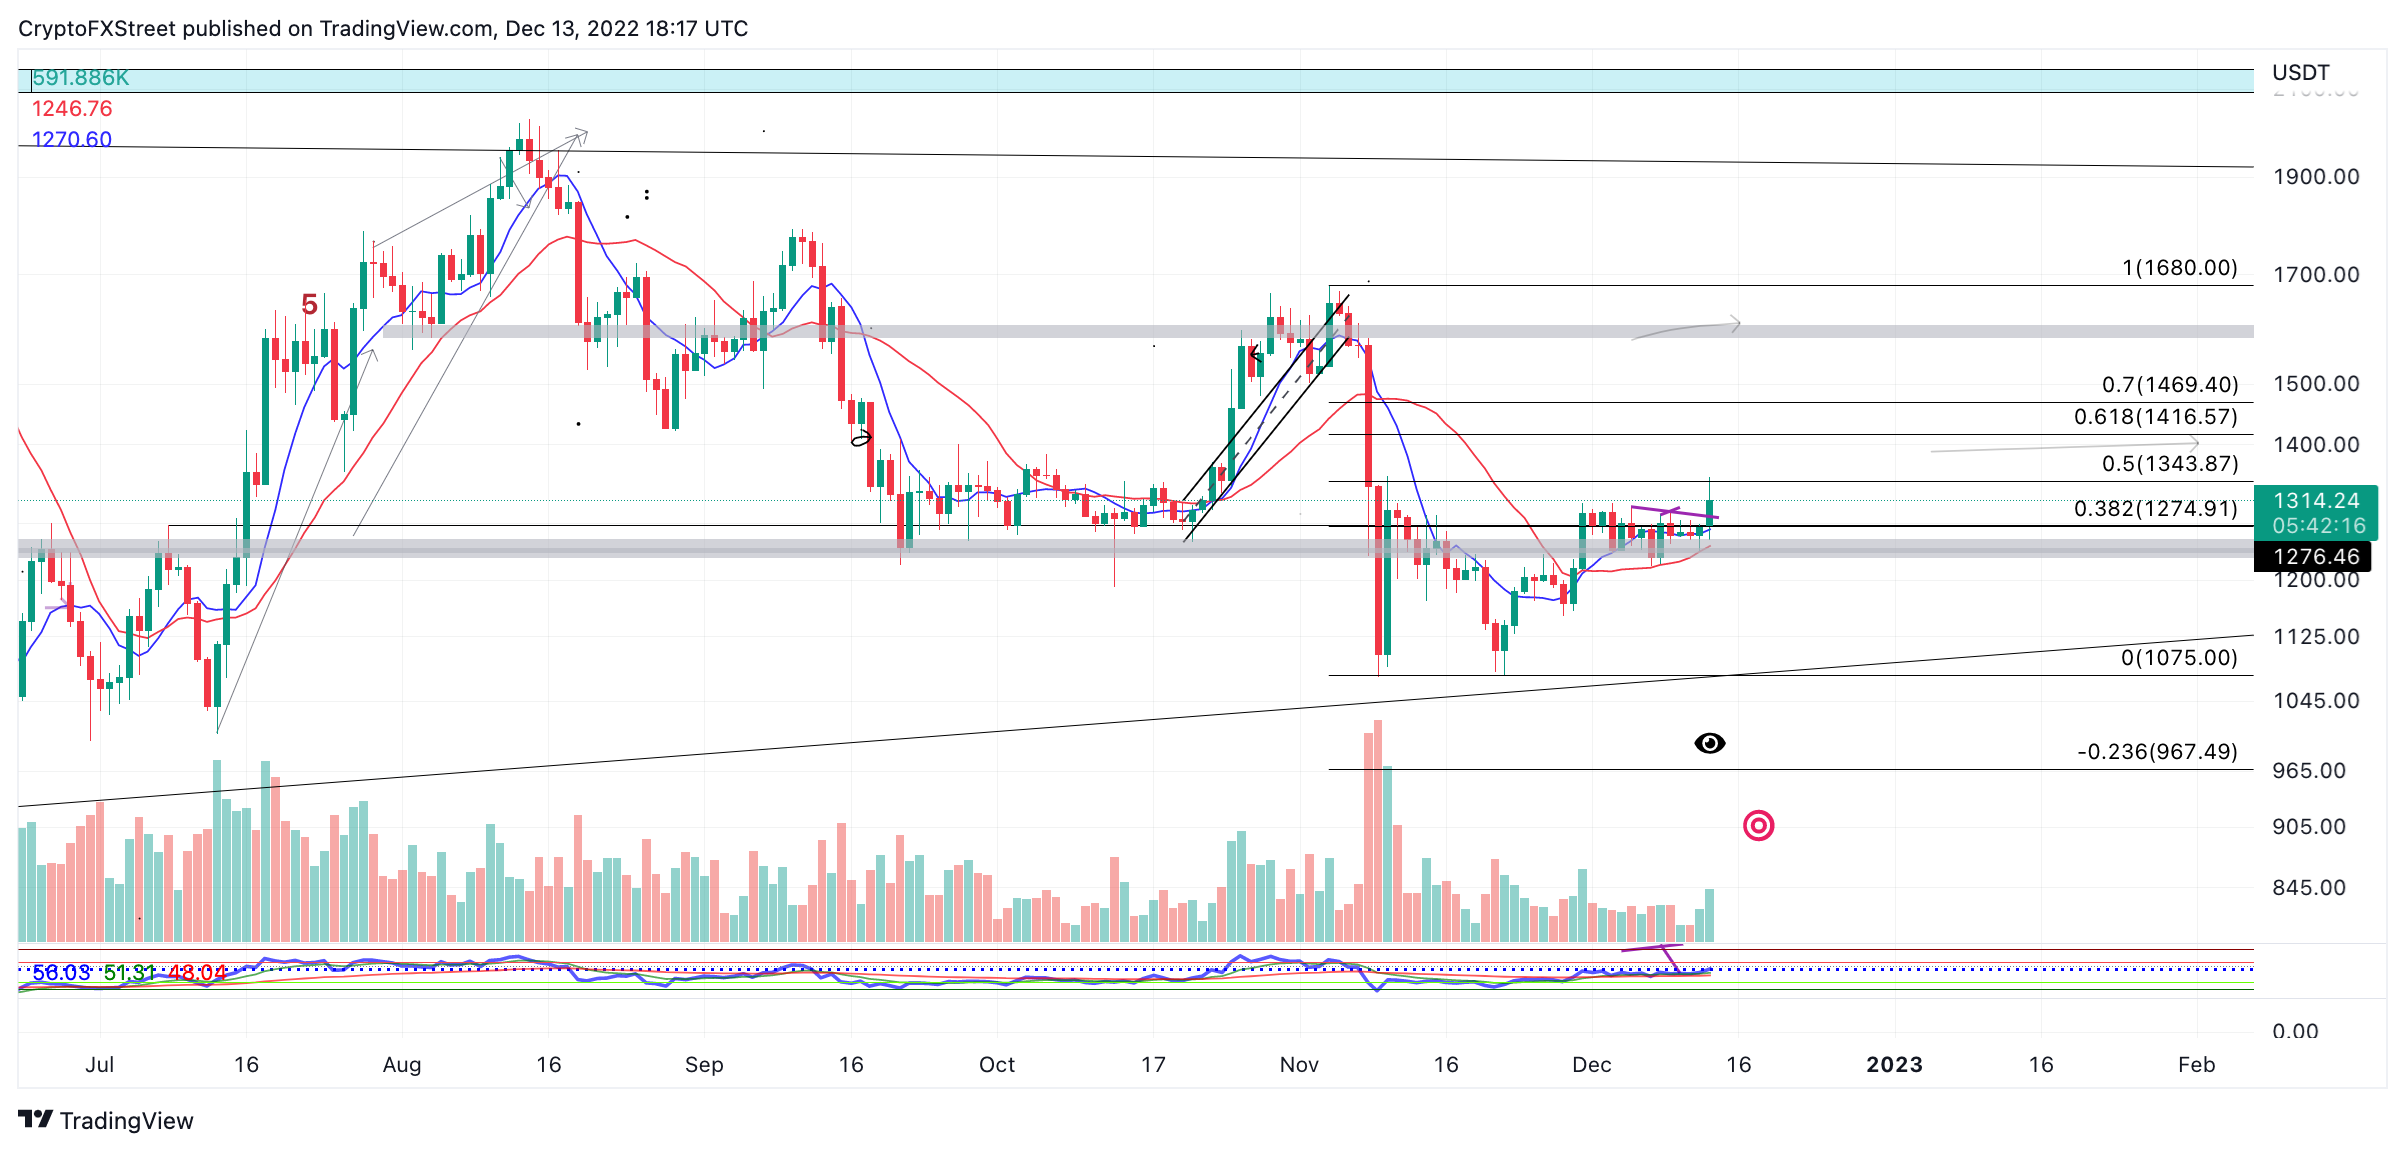
Ethereum's price has moved in unison with its Bitcoin counterpart, returning 7% of lost market value to investors. On December 13, the bulls pierced a descending trend line which acted as resistance on three separate occasions since December 2. A classical technical analysis concept applied perfectly to the ETH price action as "the fourth touch of the trend" solidified gains for bulls in the market.
Ethereum price currently auctions at $1,317 as a profit-taking consolidation has begun near the 50% retracement level. Like BTC, the target zone was extracted from November's high at $1,680 to November's low at $1,075. The volume indicator shows an uptick in transactions, but fewer bulls are bidding for prices now than on the bullish days on November 10 and November 30. Because ETH rallied by 20% and 10% on the previous dates with more volume, conservative bullish targets should be applied until more evidence presents itself.
If the bulls can maintain their price action above the recently breached trendline, the 61.8% Fib retracement level at $1416 would be the next bullish target. ETH's market value would increase by 7% if said price action occurred.
ETH/USDT 1-Day Chart
A breach below the recent swing low at $1,238 would void the bullish potential. If the low is tagged, ETH could decline back into the range and tackle the range low near $1,075, resulting in an 18% decrease from the current market value.
XRP price detrends from the others
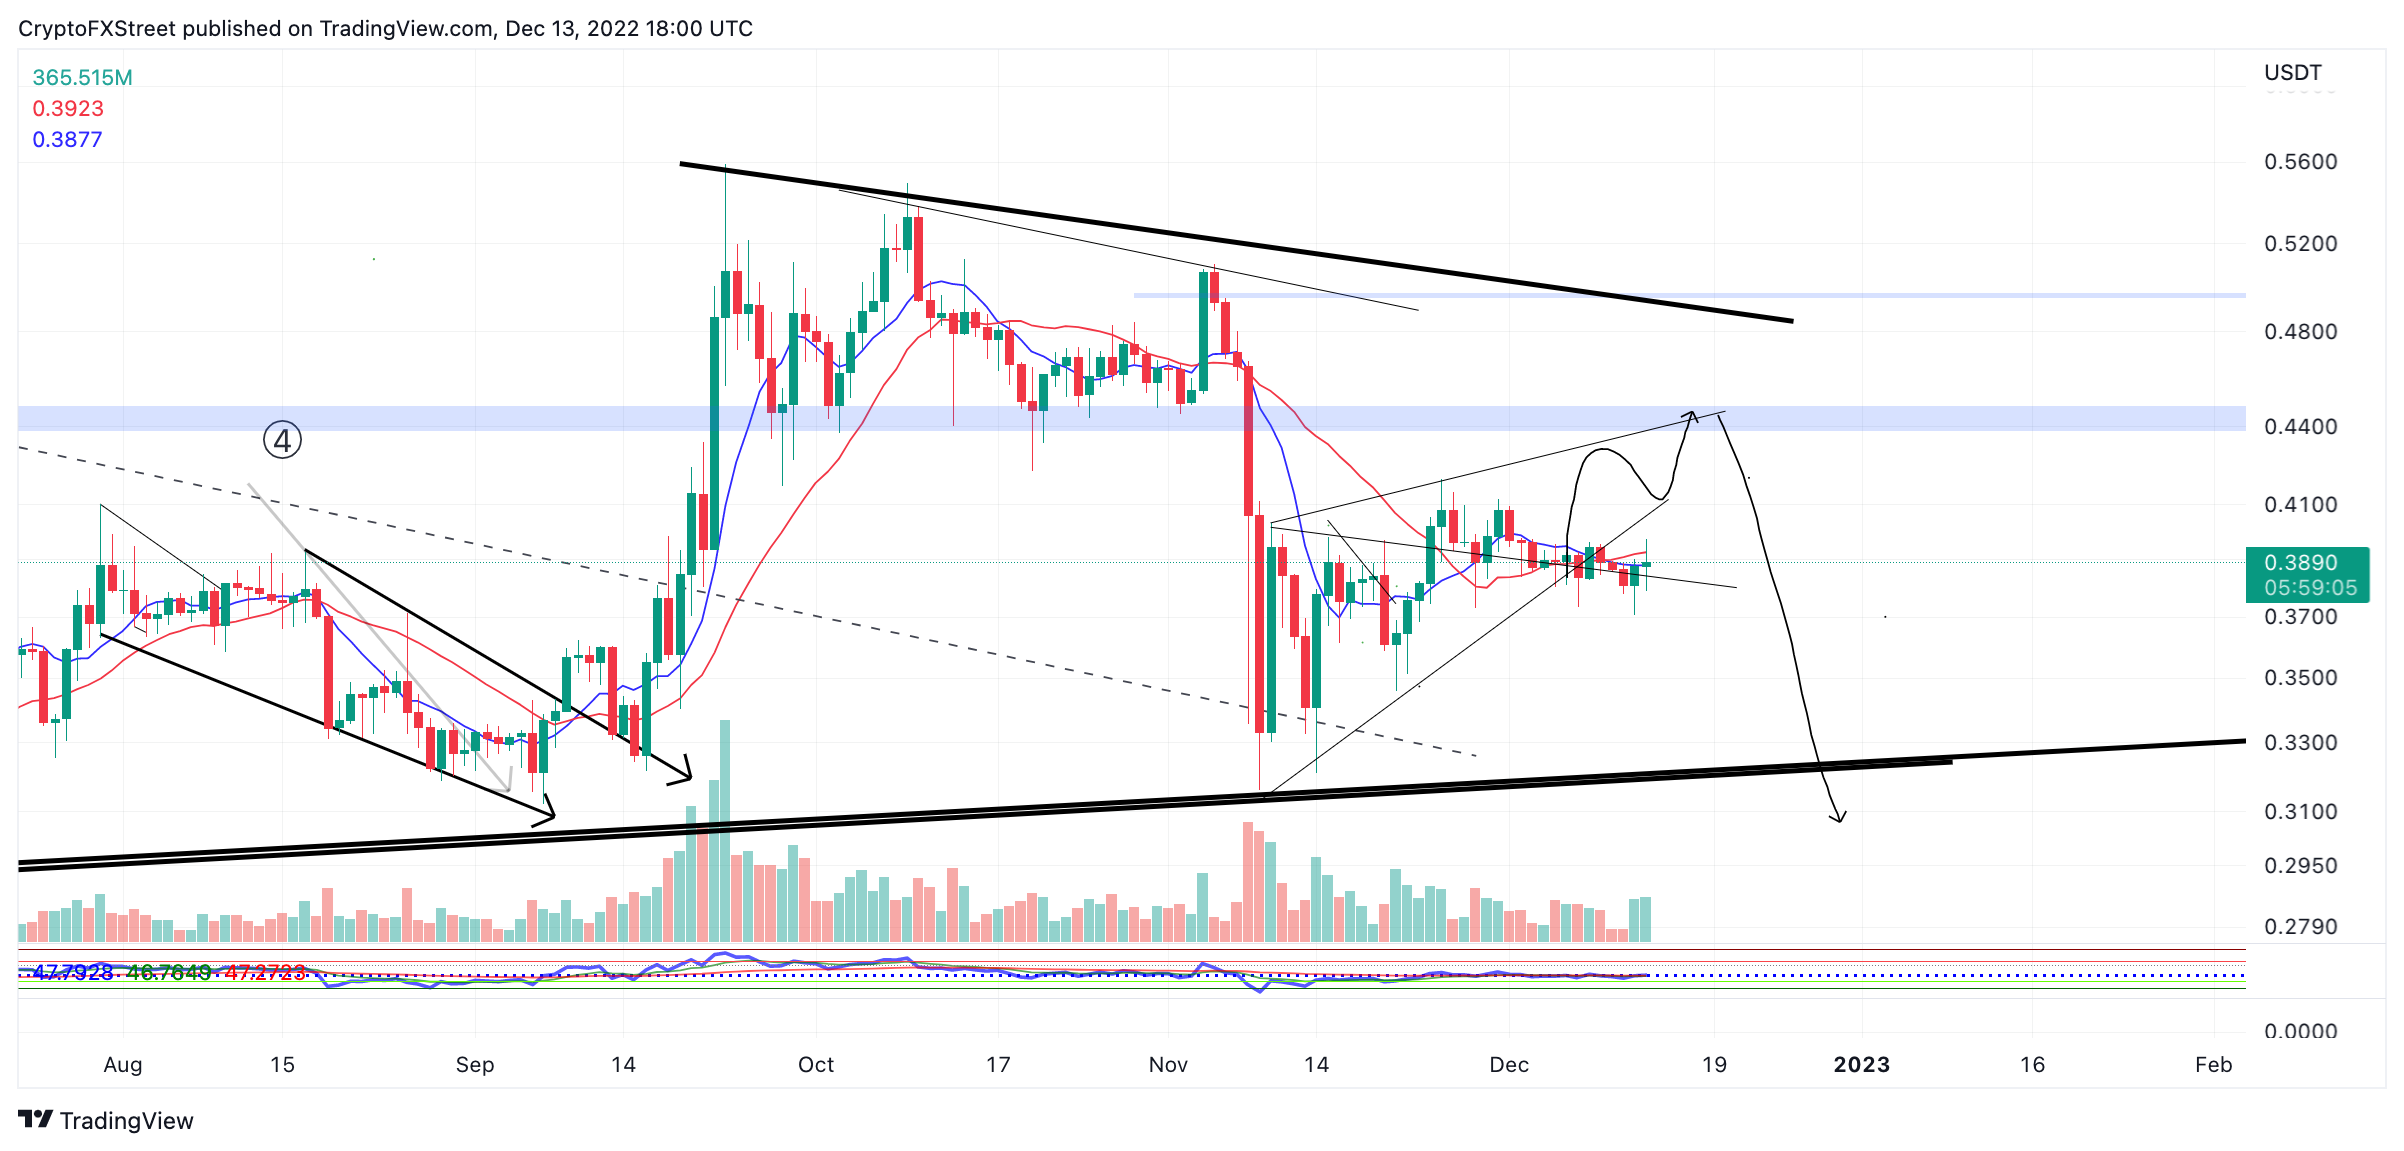
XRP price witnessed no change in price despite the US CPI data release. At the time of writing, Ripple remains coiled between the 8-day exponential and 21-day simple moving averages while dually finding support on a previous resistant trend line.
XRP price currently auctions at $0.389. The digital remittance token’s refusal to rally higher, like Ethereum and Bitcoin, shows XRP's correlation to risk assets is decreasing. Furthermore, on December 12, the XRP price subtly changed market structure by printing a lower low than the previous two swings at $0.370. Although the signs may be early, XRP price could be setting up for a drop towards the other half of November's trading range.
XRP/USDT 1-Day Chart
If the market is genuinely bearish, a second attempt at $0.37 could catalyze a 17% decline targeting November's range low near $0.32. A breach above the previous high at $0.41 will be needed to consider a countertrend bounce, potentially toward October's broken support zone at $0.44. XRP would rise by 13% increase as a result of the bullish scenario.
Author

Tony M.
FXStreet Contributor
Tony Montpeirous began investing in cryptocurrencies in 2017. His trading style incorporates Elliot Wave, Auction Market Theory, Fibonacci and price action as the cornerstone of his technical analysis.


