Top 3 Price Prediction Bitcoin, Ethereum, Ripple: Crypto season no more
- Bitcoin rejected from a key level and is losing support from indicators.
- Ethereum price shows increased momentum during the decline.
- Ripple price may experience a bearish death cross in the coming hours.

The crypto market shows early evidence of the start of a new downswing. Key levels have been defined.
Bitcoin price headed for pain
Bitcoin price currently trades at $19,414. The 21-day Simple Moving Average (SMA) has been lost as support, as the peer-to-peer digital currency fell in free-fall fashion on Tuesday, October 18. The move south was catalyzed by a previous triangle apex, which has persistently acted as support since the beginning of September.
If the bulls do not provide support at the 8-day Exponential Moving Average stationed at $19,222, a sweep of the summer lows at $17,880 could occur. If the bulls do not capitulate near this level, investors can expect a $16,000 BTC price to finally show up on the market as well.
Invalidation for traders willing to participate in the bearish trade setup is a breach above the rejected triangle apex at $20,300. Said price action could be the catalyst to send Bitcoin price back to $25,400, resulting in a 30% increase from the current BTC price.
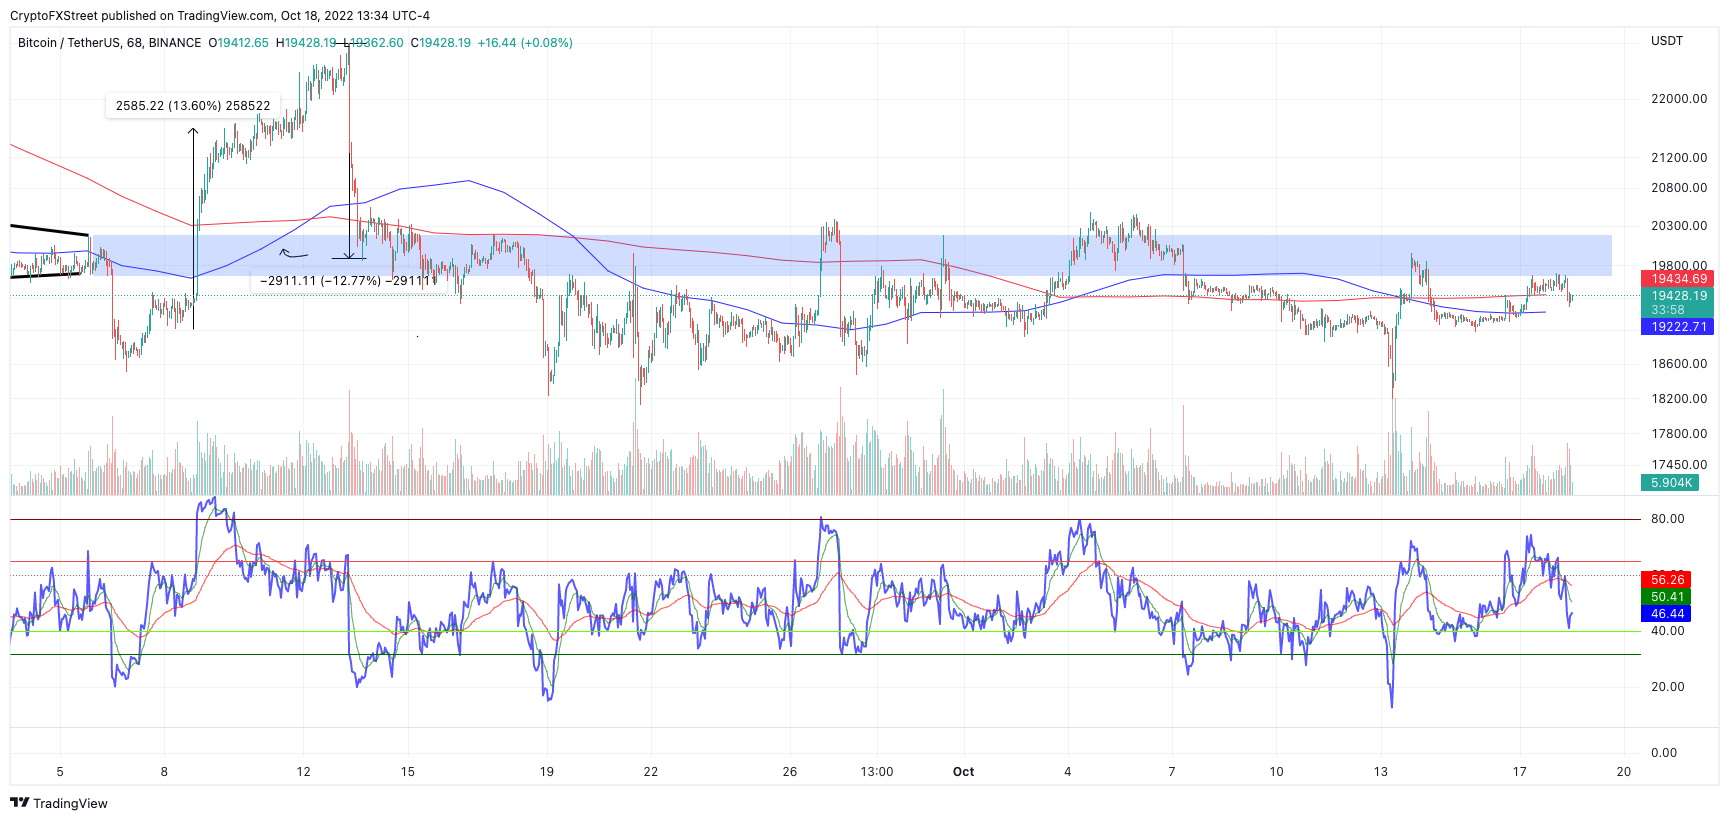
BTC/USDT 1-Hour Chart
In the following video, our analysts deep dive into the price action of Bitcoin, analyzing key levels of interest in the market. -FXStreet Team
Ethereum price shows a bearish influx
Ethereum price has been rejected from the mid-$1,300 to start the third trading week of October. A subtle uptick in volume is displayed on intra-hour time frames, while the Relative Strength Index shows an increase in bearish momentum. Combining these indicators’ narratives could suggest the decentralized smart contract token is in phase one of a new move south.
Ethereum price now trades at $1,316 as the bears have breached the 21-day SMA. If the bulls do not show up at the 8-day EMA near $1,280, a sweep of the October lows at $1,205 will come as no surprise.
The bearish invalidation level is a breach above the October high at $1,383. If the bulls can accomplish this bullish event, a continuation rally into September high at $1,718 stands a fair chance of occurring. The ETH price would subsequently rise 36% from the current market value.
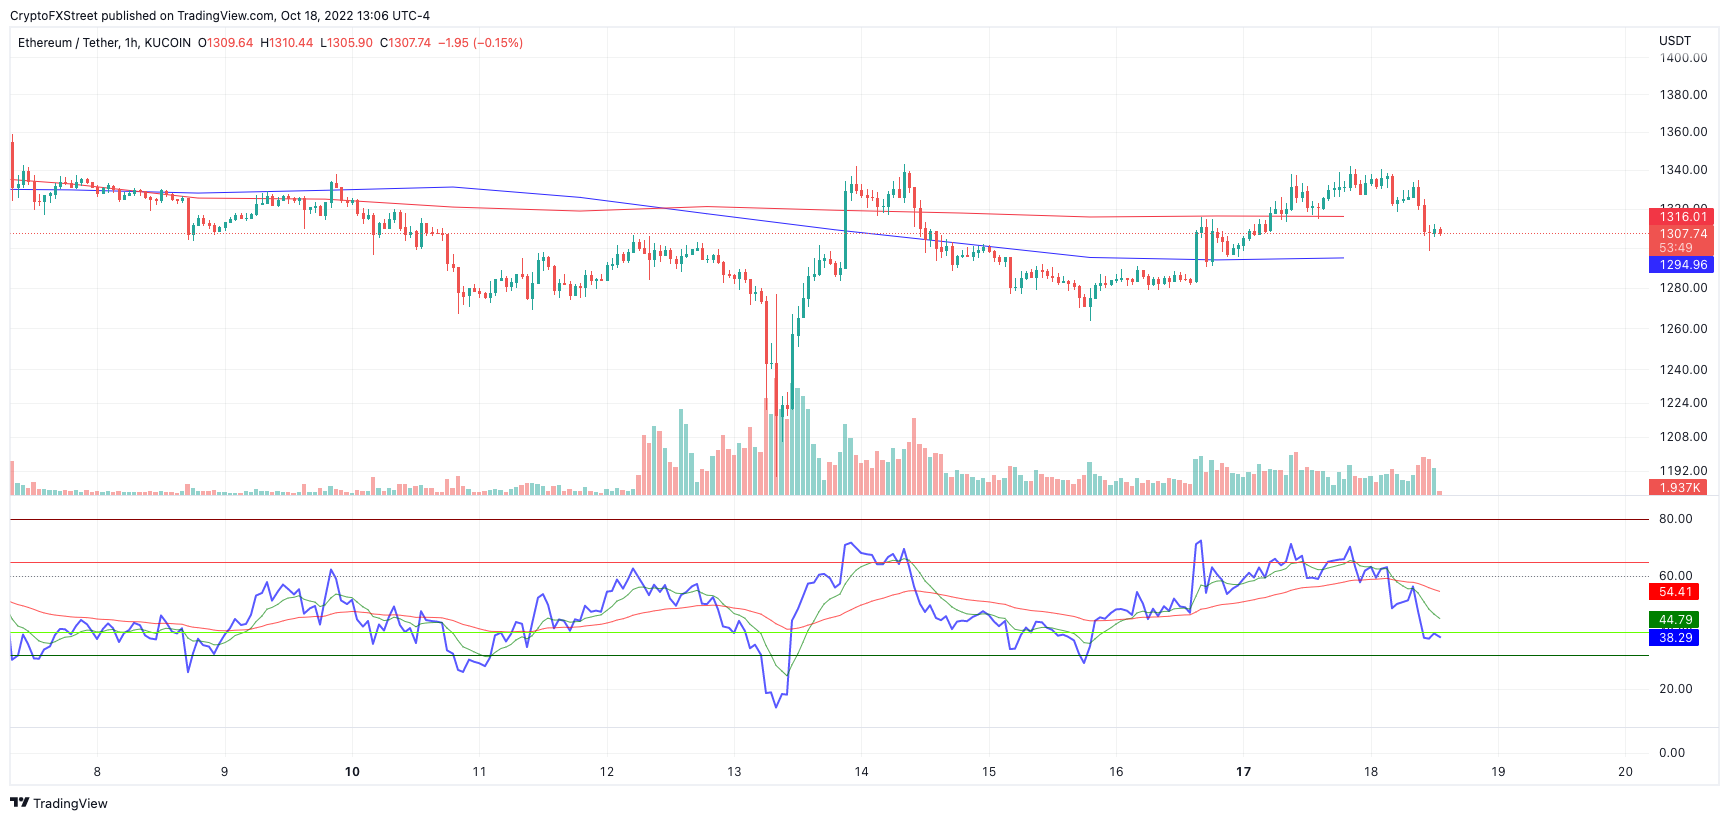
ETH/USDT 1-Hour Chart
In the following video, our analysts deep dive into the price action of Ethereum, analyzing key levels of interest in the market. -FXStreet Team
Ripple price looks subdued
XRP price currently auctions at $0.47. The 8-day EMA and 21-day SMA are positioned differently when compared to Bitcoin and Ethereum. On Monday, October 17, the bulls were rejected from both indicators simultaneously near $0.485.
The digital remittance token could be at a critical point for investors as the rejected moving averages are likely to produce a bearish death cross signal in the coming hours. Such a move could wreak havoc on the XRP price. Liquidity levels near $0.40 and potentially $0.37 would be in jeopardy for up to a 19% decline from the current market value.
Invalidation for the bearish downtrend is a breach above $0.50. If the bullish move occurs, a buyers frenzy targeting September highs at $0.56 could occur, resulting in a 19% increase from the current XRP price.
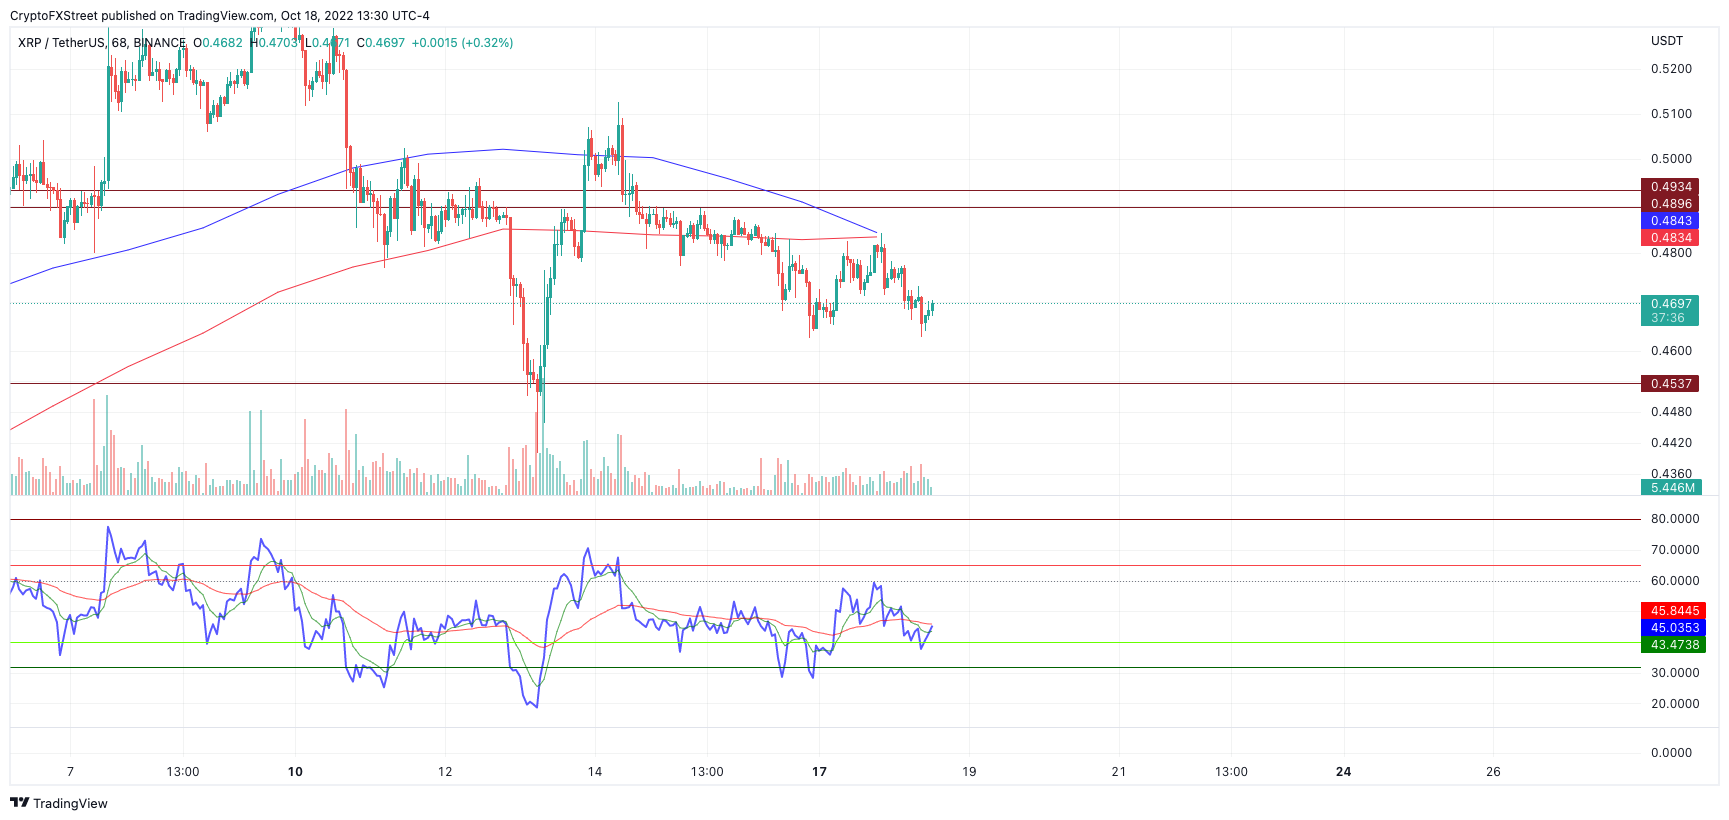
XRP/USD 1-Hour Chart
In the following video, our analysts deep dive into the price action of Ripple, analyzing key levels of interest in the market. -FXStreet Team
Author

Tony M.
FXStreet Contributor
Tony Montpeirous began investing in cryptocurrencies in 2017. His trading style incorporates Elliot Wave, Auction Market Theory, Fibonacci and price action as the cornerstone of his technical analysis.


