Top 3 Price Prediction Bitcoin, Ethereum, Ripple: Selling the oversold is not the best idea
- Bitcoin price witnesses a sharp 4% sell-off to end the first trading week of October. 2
- Ethereum price shows extreme oversold market conditions on the Relative Strength Index.
- Ripple has not had much price movement and has yet to decide where the next trending direction

The crypto market is witnessing last-minute sell-offs to end the first week of October. Sidelined bears should be cautious as indicators show most digital assets are extremely over at the moment.
Bitcoin price takes a fall
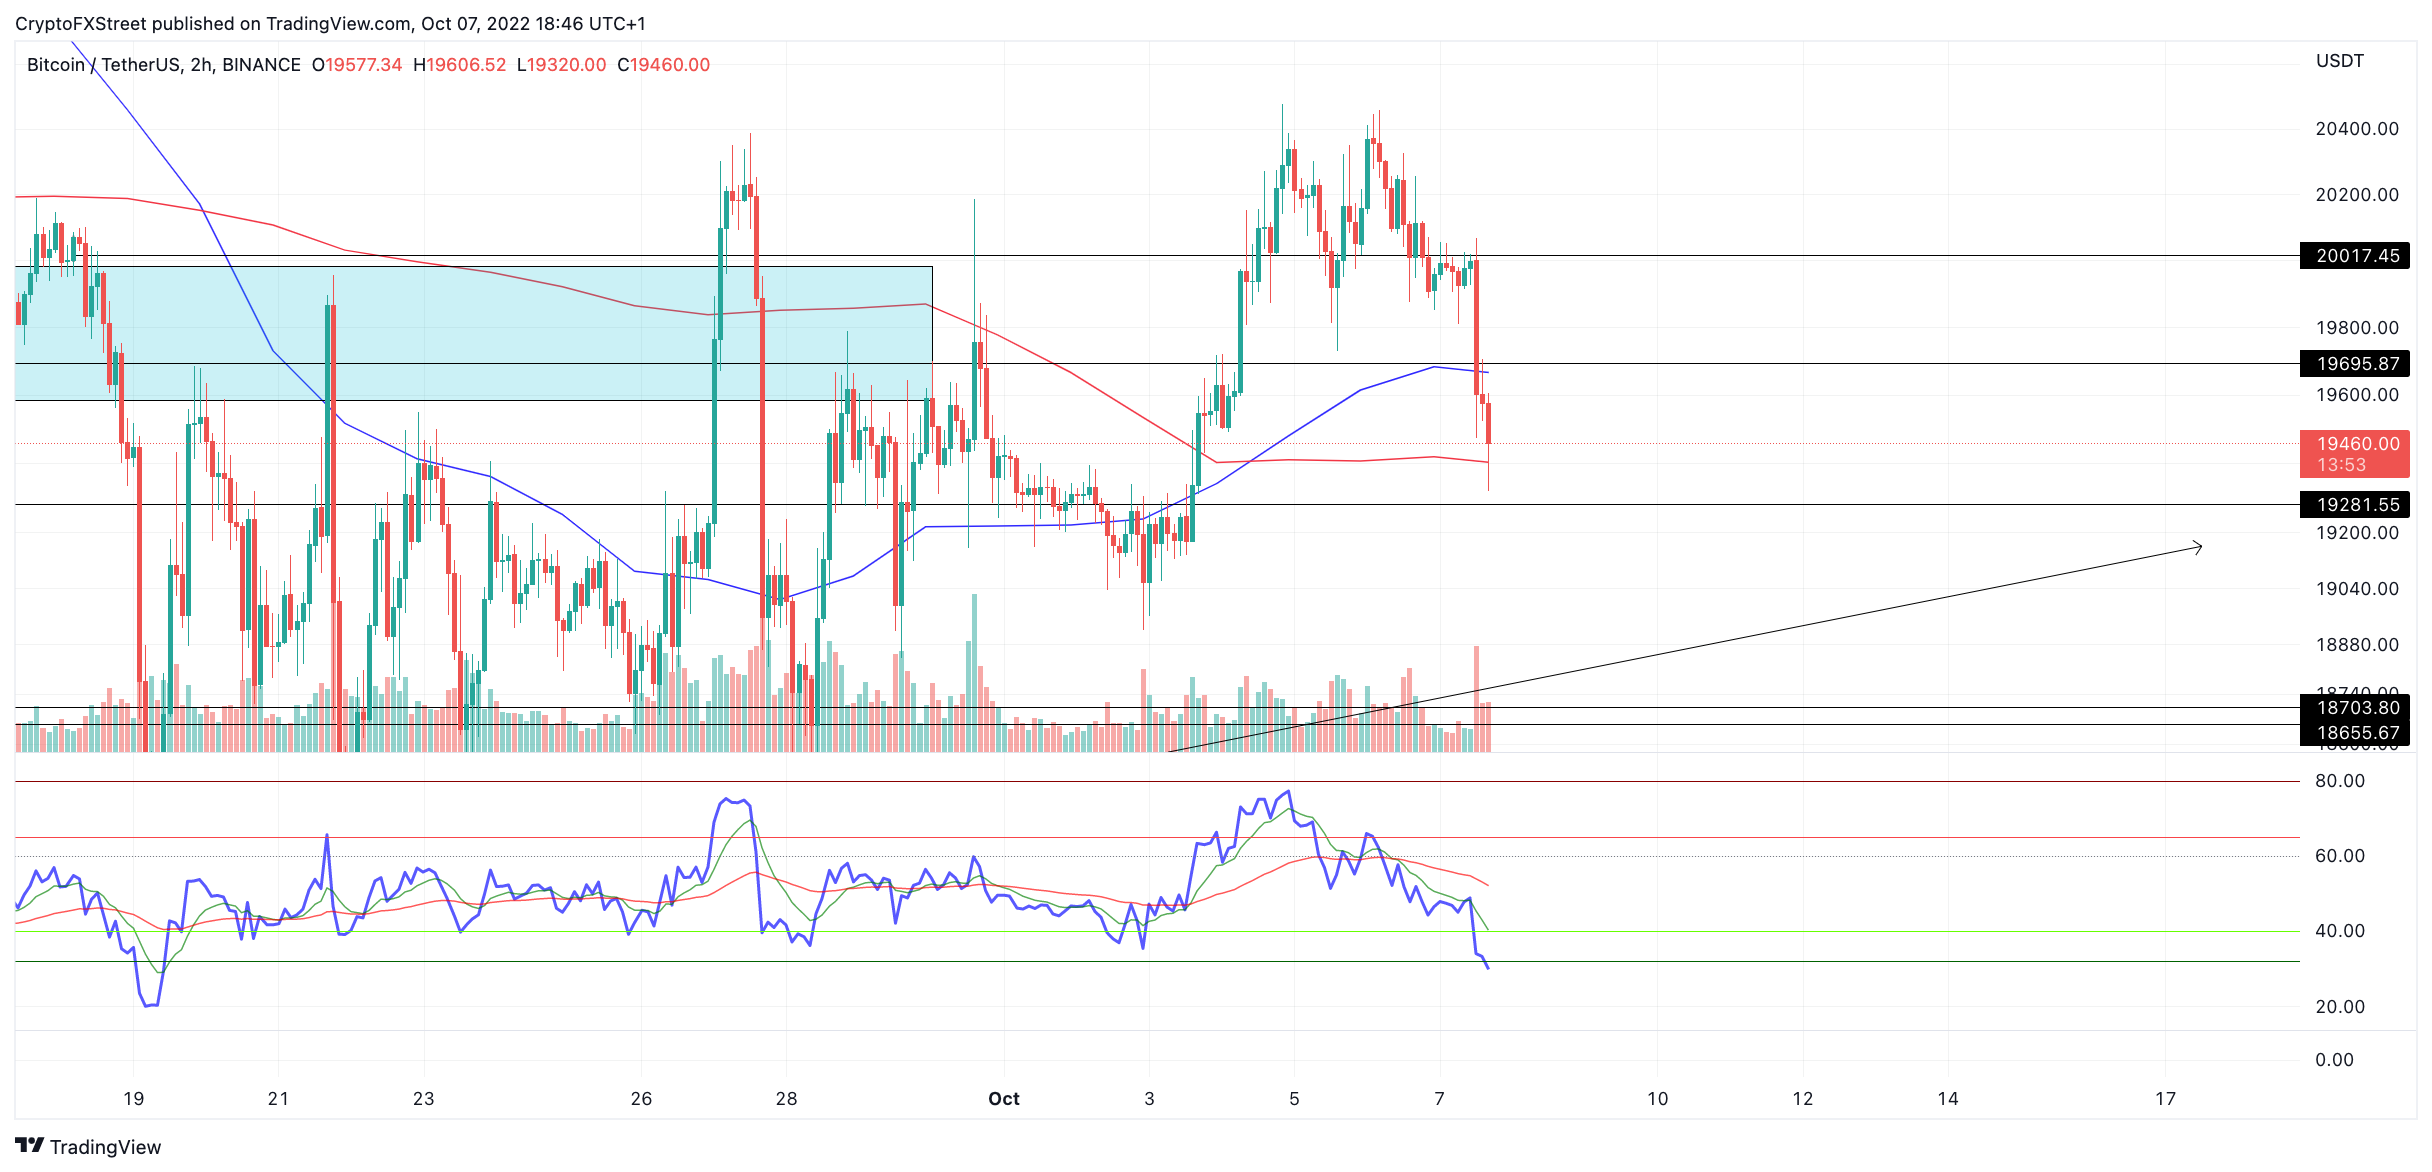
Bitcoin price shows have fallen sharply by 4% on Friday, October 7. After experiencing congestion near $20,000, the BTC price was sharply rejected and has since fallen in free-fall fashion.
Bitcoin price currently auctions at $19,411. The peer-to-peer digital currency has shown a considerable uptick in volume during the current sell-off., The Relative Strength Index has fallen into extremely oversold territory and printed a bullish divergence as well. displayed several bearish divergences during the summer. Additionally, the bears have established a breach through the 8- exponential moving average and look to test the 21-day simple moving average just below $19,407
IF market conditions persist, the 18,000 zone could be a key target for bears in the market during October. Due to the extremely oversold reading on the RSI, the bulls should be able to show some retaliative force in the coming days, presumably back into the $20,000 price level. Traders should keep their eyes on the pullback to see if an additional opportunity to short will present itself. At the current time, placing a short entry would be ill-advised.
Therefore this thesis remains neutral with an overall bias that BTC will rotate near the moving averages and recover part or all of the lost value during the last-minute sell-off throughout the weekend After a definitive pullback, the potential for more decline could be on the table targeting $18,000. Such a move would result in a 5% decrease from the current market value.
BTC/USDT 1-Day Chart
In the following video, our analysts deep dive into the price action of Bitcoin, analyzing key levels of interest in the market. -FXStreet Team
Ethereum price falls south
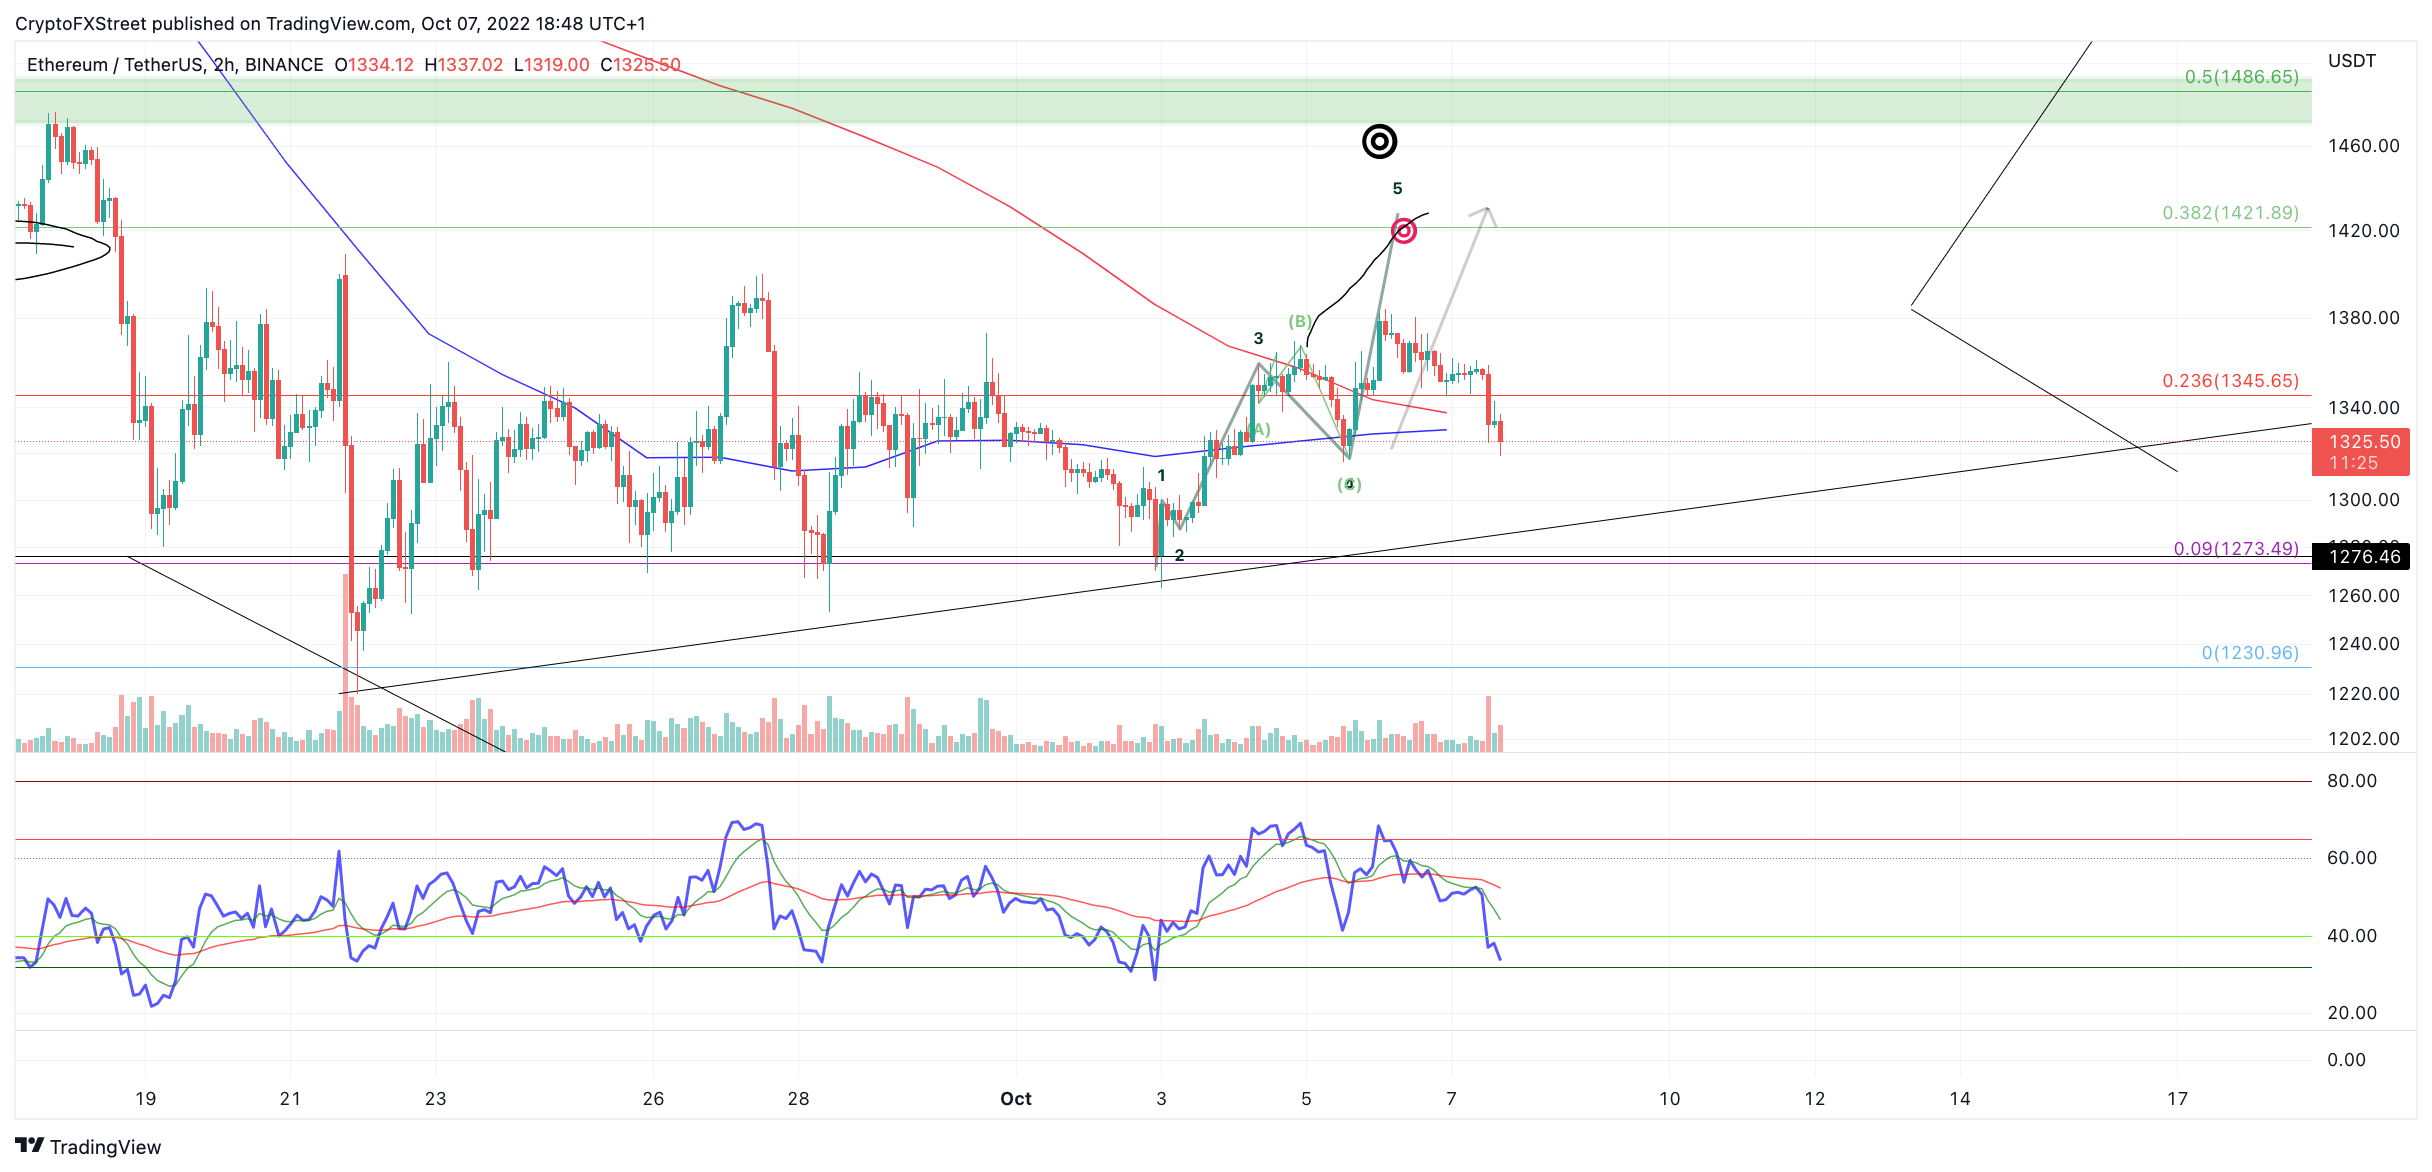
Ethereum price, just like Bitcoin, has suffered a blow. The bulls failed to hold support near the $1350 price level and are now witnessing a penny from Eiffel Style decline on smaller time frames. The decentralized smart contract token is currently down 5% and counting.
Ethereum price currency trades at $1,323. The Volume Profile has consistently shown a large influx of transactions amidst the catalyst of the decline. Relative Strength Index shows the current sell-off as extremely oversold and shows subtle bullish divergences with $1300 lows on October 1st. At the current time, the ETH price is attempting to breach through both the 8 -day and exponential moving averages but is likely to experience some chop before a true break of structure occurs.
If market conditions persist, a breach of the $1,200 barrier could concur in the days to come. Bears should be very cautious to enter the market due to the oversold positioning of the Relative Strength Index and underlining support from the moving averages.
Invalidation of the Bearish thesis is a breach above $1400, as Ethereum has repetitively produced V shape recovery rallies after falling into oversold territory. If $1400 is breached, an additional rise towards $1480 could occur, resulting in a c giving room for a trigger a sharp decline targeting $1,420. Such a move would result in a 15% increase from the current Ethereum price.
ETH/USDT 1-Day Chart
In the following video, our analysts deep dive into the price action of Ethereum, analyzing key levels of interest in the market. -FXStreet Team
XRP price is still indecisive
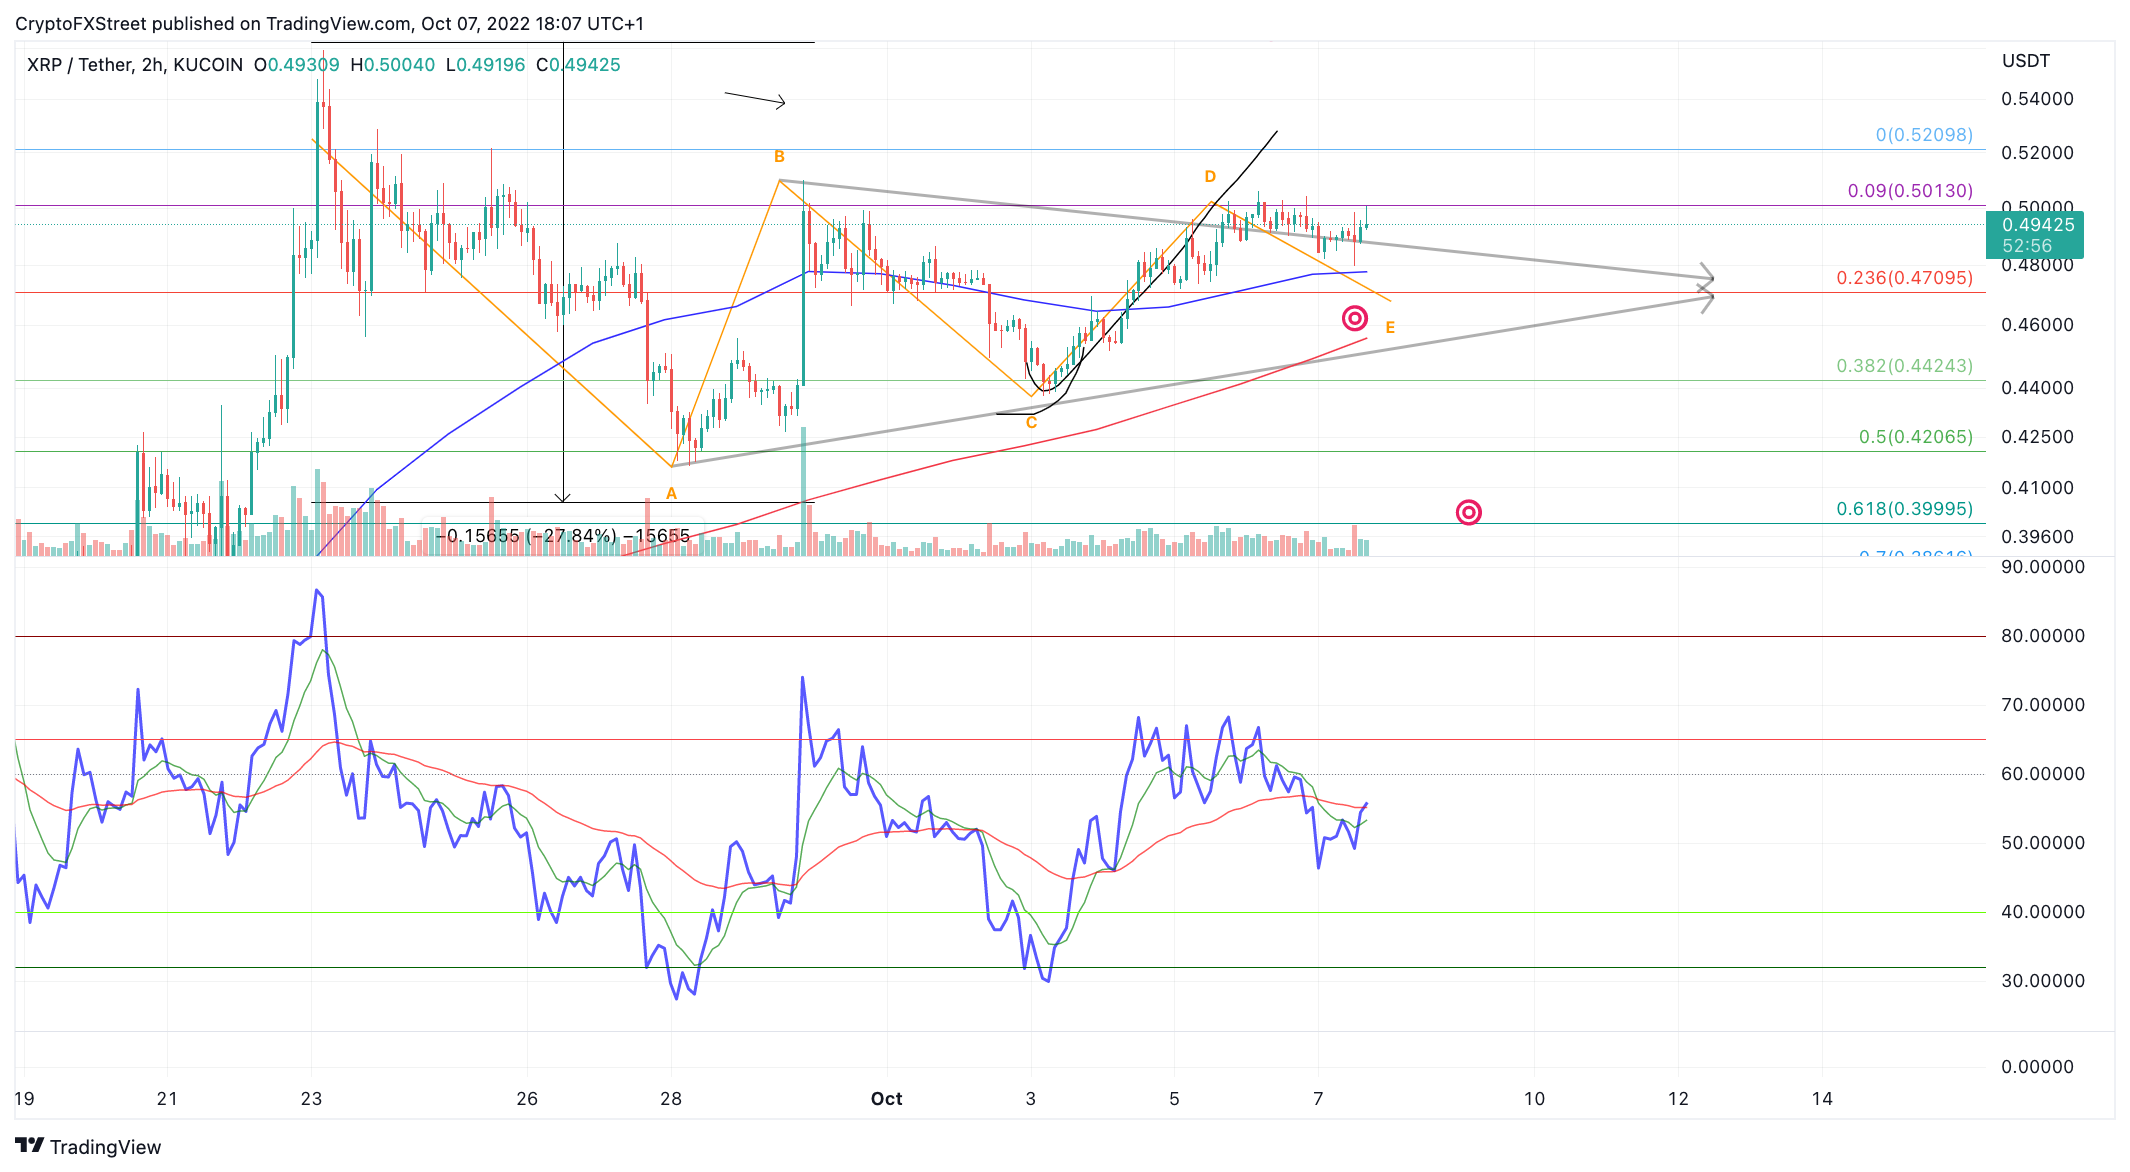
XRP price is currently up 15% this week as an early week rally took place from $0.44. At current time RIpple is struggling to hurdle the $0.50 barrier as several attempts throughout the week have failed. A subtle influx of volume has recently come into the market near the $0.50 barrier, but generally, transactions remain low during the overall uptrend display. The price action could be a cue that the uptrend move’s power is waning.
XRP price currently auctions at $0.49. The bulls still hover above both the 8-day EMA and 21-day SMA, which adds confusion to the mix. Additionally, the Relative Strength Index is still within the bounds of support for a healthy uptrend on smaller time frames.
Combining these factors, the next move is anyone's game. A breach of the $0.51 barrier could give way to a bullish move toward $0.56, While failure to hurdle the $0.51 could ultimately lead to a liquidation event targeting $0.47 and $0.44.
XRP/USDT 1-Day Chart
In the following video, our analysts deep dive into the price action of Ripple, analyzing key levels of interest in the market. -FXStreet Team
Author

Tony M.
FXStreet Contributor
Tony Montpeirous began investing in cryptocurrencies in 2017. His trading style incorporates Elliot Wave, Auction Market Theory, Fibonacci and price action as the cornerstone of his technical analysis.


