Top 3 Price Prediction Bitcoin, Ethereum, Ripple: Turbulence en route to the moon
- Bitcoin price ascends but could be capped near upper $20,000 levels.
- Ethereum price shows potential to rally back towards $1,400, but caution should be applied.
- Ripple's XRP price coils in a triangular fashion, hinting that a new high for September is on the cards.

The crypto market ascends what some traders would refer to as noisy behavior. At the current time, the next trend is more of a guessing game than a sure thing. Still, key levels have been identified to gain an advantage in this turbulent environment.
Bitcoin price is for range traders
Bitcoin price, at the time of writing, auctions at $19,972. The bulls have breached the 21-day simple – and exponential – moving averages to start the first week of October. This thesis supports the idea that a countertrend rally will probably occur.
Bitcoin price has the potential to rally higher as higher lows have been established on the 8-hour chart, but the Relative Strength Index (RSI) has yet to display the necessary momentum to back up a bullish scenario. In fact, if anything, the indicator is showing potential for a double top formation near the current price levels. A pullback into the recently breached moving averages near $19,200 is a reasonable forecast, while a breach above the $20,700 thrust candle may invalidate the pullback scenario.
Traders may want to consider adopting a “fade the extreme” mentality as the BTC could continue to produce range-bound price action before a definitive influx of volatility pours over to one side of the boat and gives it direction.
The safest invalidation of the bearish thesis for long-term investors is a break above the September high at $22,800. If the bulls can challenge this level, a buying frenzy could erupt and give way to a challenge of the August high at $25,214. Such a move would result in a 25% increase from the current Bitcoin price.
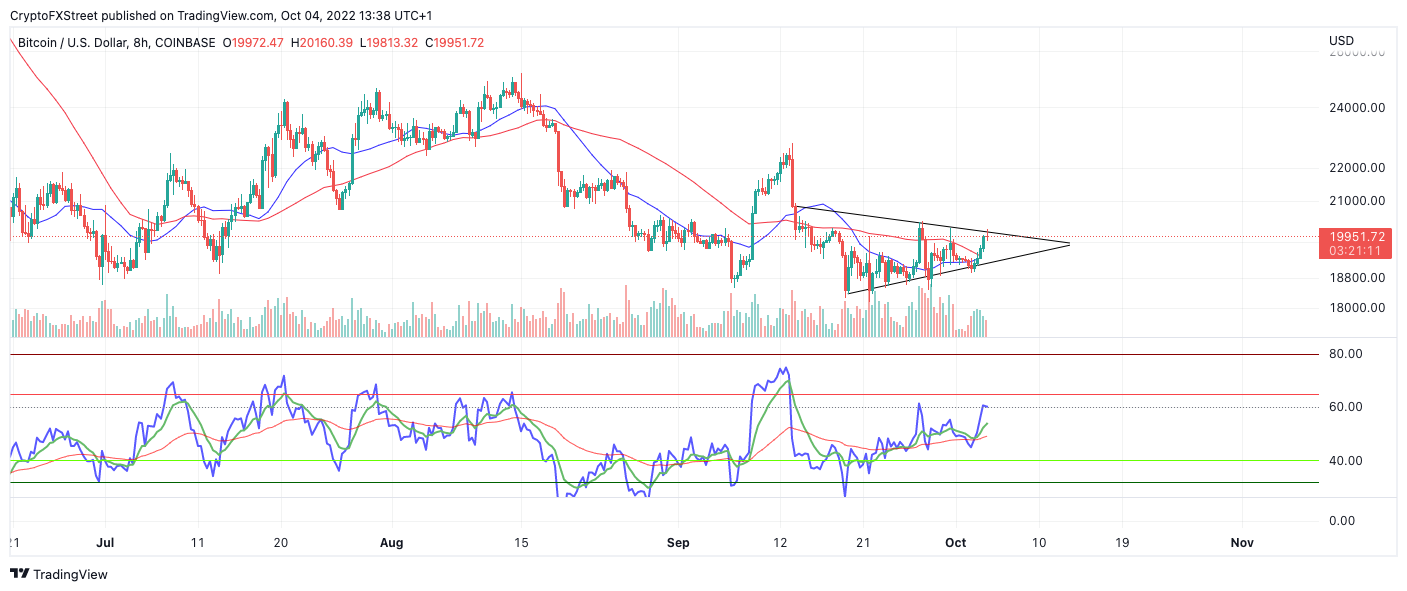
BTC/USD 8-Hour Chart
In the following video, our analysts dive deep into the price action of Bitcoin, analyzing key levels of interest in the market. -FXStreet Team
Ethereum price in profit
Ethereum price shows potential for a much larger counter-trend rally underway. The bulls have experienced a 7% profit within 24 hours as the smart contract token ascends in stair-step fashion. During the hike, the 8-day Exponential Moving Average (EMA) was successfully breached, while the 21-day Simple Moving Average (SMA) is acting as resistance just above the current price action.
Ethereum price currently auctions at $1,352. The RSI has caught wind of momentum on smaller time frames. The influx of buying pressure could propel ETC price toward higher targets. Key levels of interest are the 21-day SMA at $1,370 and the two $1,400 swing highs that formed a double-top bearish reversal pattern.
For the safety of our readers, aiming for any higher targets relies on the October 3 swing low at $1,263 remaining untagged. Losing this level of support would deem the counter-trend play void. The bears would likely target liquidity levels near $,1100, resulting in a 12% decrease from the current Ethereum price.
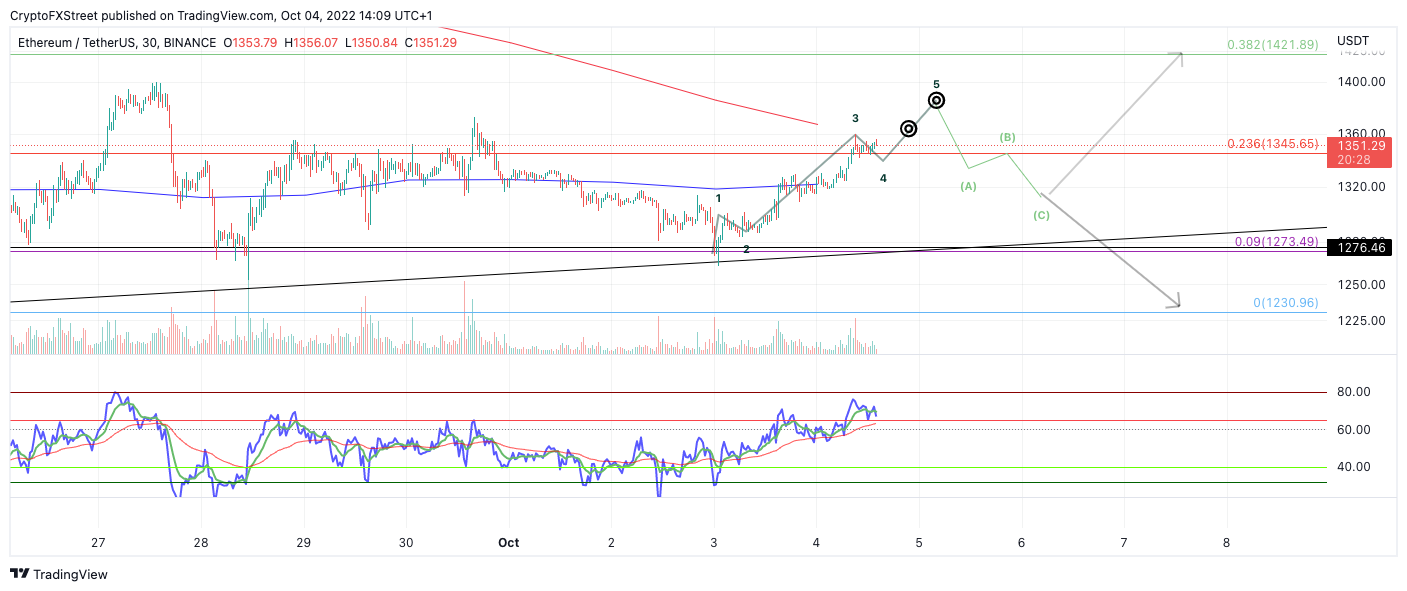
ETH USDT 30 Min Chart
In the following video, our analysts dive deep into the price action of Ethereum, analyzing key levels of interest in the market. -FXStreet Team
Ripple price coils before the next big move
Ripple's XRP price is currently up 10% on the month, as bulls are stepping into the market to hold support in the upper $0.40 levels. After an impressive 70% rally witnessed in September, XRP’s price action has gone range bound, creating what appears to be an ascending triangle pattern.
XRP price currently auctions at $0.48. The coiling Elliot Wave pattern appears to be in its fourth leg and could witness one more pullback before a true bull rally occurs. The Volume Profile indicator supports this idea as the XRP price is rising with less volume than the previous rally into the $0.51 swing high.
The bulls have breached through the 8-day EMA, but the RSI is not displaying the appropriate momentum for a genuine rally. If market conditions persist, a retest of the $0.45 stands a high chance of occurring. If $0.45 does not hold, a 10% decline to sweep the $0.43 lows will likely occur.
Invalidation of the bearish scenario would come from a breach above the September 29 swing high at $0.51. If the bulls can breach this level, the anticipated rally towards $0.61 will likely get underway. Such a move would result in a 27% increase from the current XRP price.
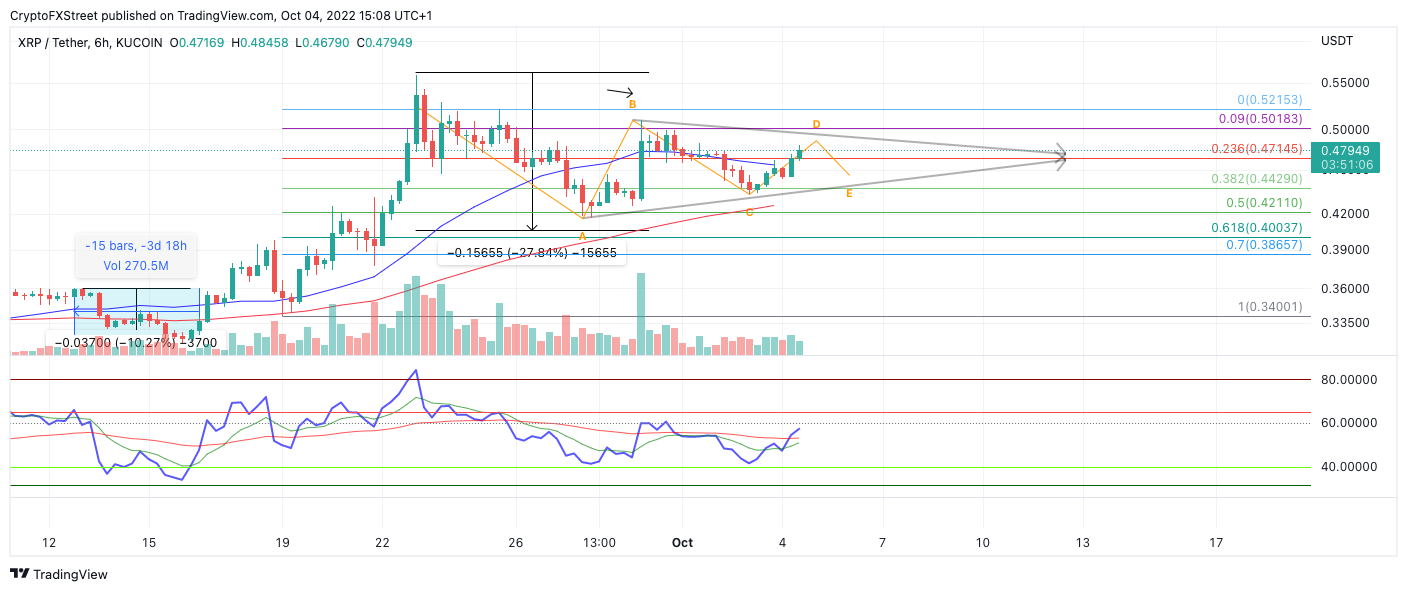
XRP/USDT 6-Hour Chart
In the following video, our analysts dive deep into the price action of Ripple, analyzing key levels of interest in the market. -FXStreet Team
Author

Tony M.
FXStreet Contributor
Tony Montpeirous began investing in cryptocurrencies in 2017. His trading style incorporates Elliot Wave, Auction Market Theory, Fibonacci and price action as the cornerstone of his technical analysis.


