Top 3 Price Prediction Bitcoin, Ethereum, Ripple: Crypto majors strike formidable resistance, short-term upside limited
- Bitcoin price has realized the easy money, now faces a myriad of resistance levels.
- Ethereum price tags the upper trend line of the descending triangle, but flashes a bearish momentum divergence on the intra-day charts.
- XRP price reaches inflection point after a 42% rally over nine trading days.

Bitcoin price has spoiled investors during a relentless rebound from the July low. Still, it is time for some form of corrective process to release the price compression generated during the rebound. Ethereum price records a rare rebound of nine consecutive up days, confirming a firm low for the smart contracts giant. XRP price triggers double bottom, raising the probabilities of a test of $1.00.
Bitcoin price prefers a correction in time, not price
Bitcoin price closed yesterday with a rare nine consecutive up days and a gain of over 34% during the streak, marking the best gain nine-day return since February and, more importantly, a definitive break with the corrective price action that dominated BTC since the March crash. Moreover, the rebound lifted the daily Relative Strength Index (RSI) to the first overbought reading since the March high.
The resumption of dominance in the cryptocurrency complex began with a daily close above the upper trend line of a falling wedge pattern on July 22. The pattern indicated that a bullish resolution of the Bitcoin price churn was near as downside momentum continued to wane. The result was a bullish engulfing week on the bar charts last week, establishing the basis for this week’s slingshot higher.
The pace and magnitude of the move pushed Bitcoin price to a quadfecta of resistance that will dictate the intentions of BTC over the next few weeks. The first point of resistance is the Ichimoku Cloud. It has been influencing prices for the last three days. Beyond the Ichimoku Cloud is the June 15 high of $41,322, the 38.2% Fibonacci retracement of the April-June correction at $42,589 and the February 28 low of $43,016. Combined, these levels represent a significant barrier to extending the rally in the coming days, especially when considering an overbought condition on the daily RSI.
An ideal scenario for Bitcoin price is a correction in time, meaning BTC moves sideways with a mild downward drift, releasing the oversold condition. It would be a sign of a strong bid and a reluctance to capture profits.
A correction in price starts with the June 29 high of $36,675, providing credible support. If the level fails to restrict the selling pressure, the rising 50-day simple moving average (SMA) at $34,711 should successfully resist any additional weakness, yielding an almost 11% decline from the current price.
Any weakness below the tactically important 50-day SMA would require a rethink of the bullish narrative.
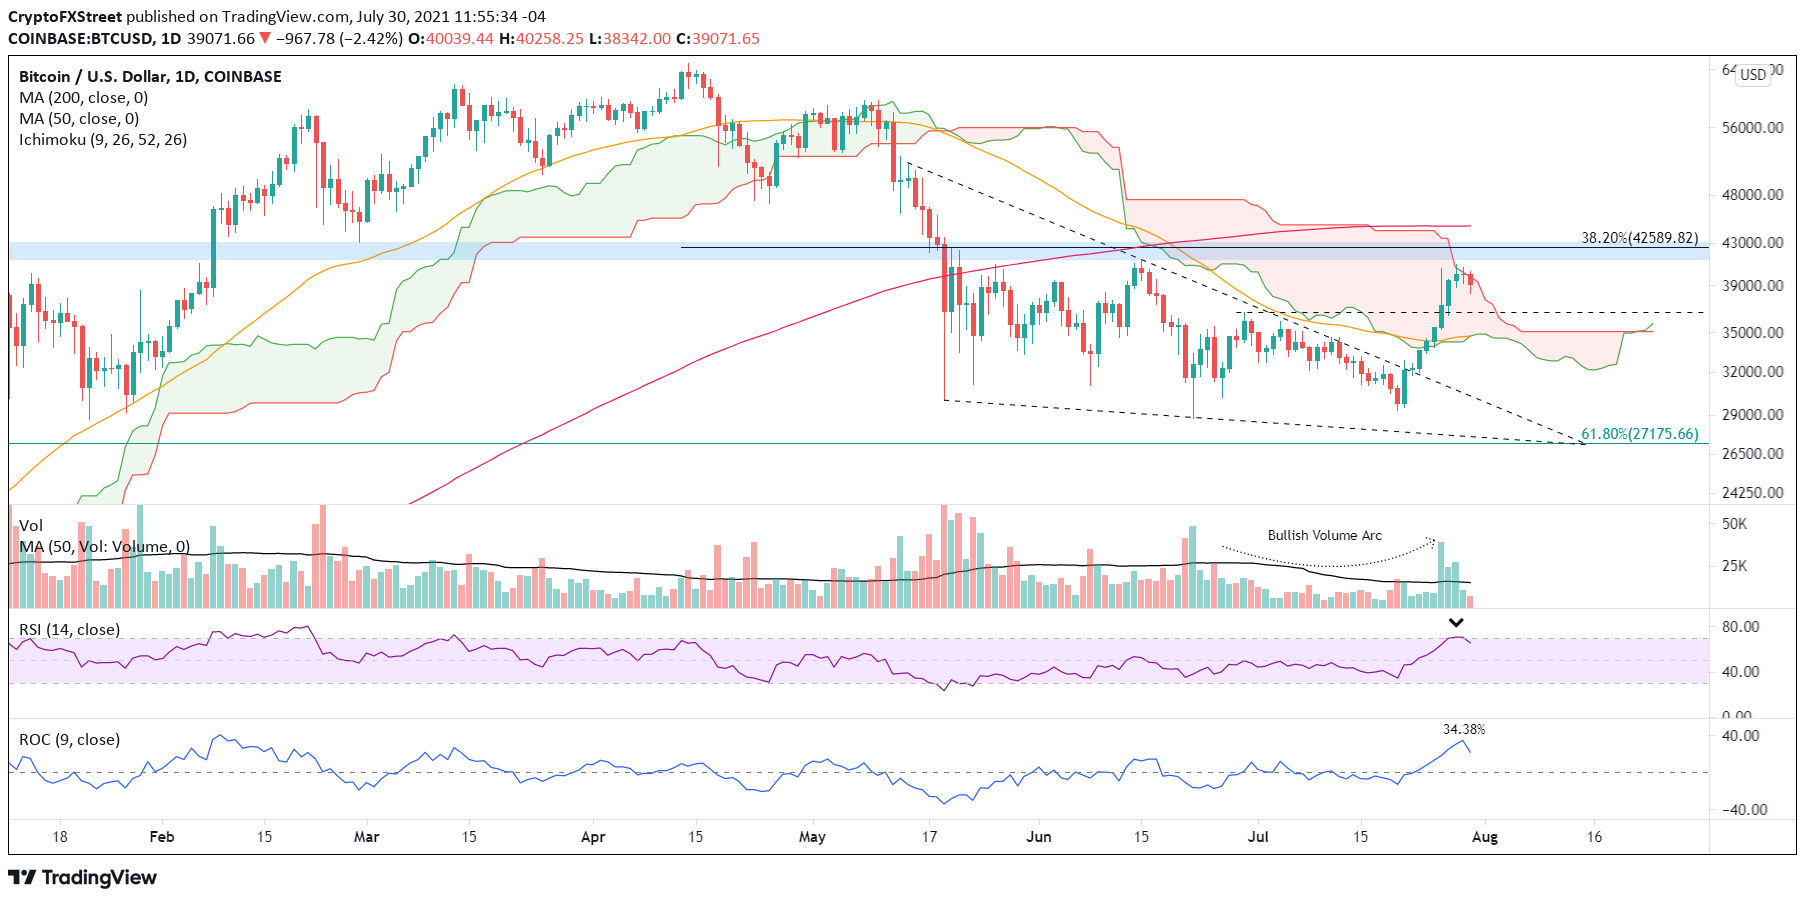
BTC/USD daily chart
Here, FXStreet's analysts evaluate where BTC could be heading next as it seems bound for a rebound before capitulation.
Ethereum price reaches a secure position
Ethereum price has recorded nine consecutive up days with a total gain of 33% since the July 20 low, representing the best nine-day return since the May high and lifting ETH to the upper trend line of the descending triangle pattern enforcing price action since the March collapse.
Unlike Bitcoin price, ETH is not overbought on the daily RSI, suggesting that Ethereum price could extend the rally beyond the trend line before evolving into a correction. However, there is a bearish momentum divergence on the six-hour chart, providing the technical impetus for a consolidation at this point. The momentum divergence also aligns with a rising wedge pattern on the specified timeframe.
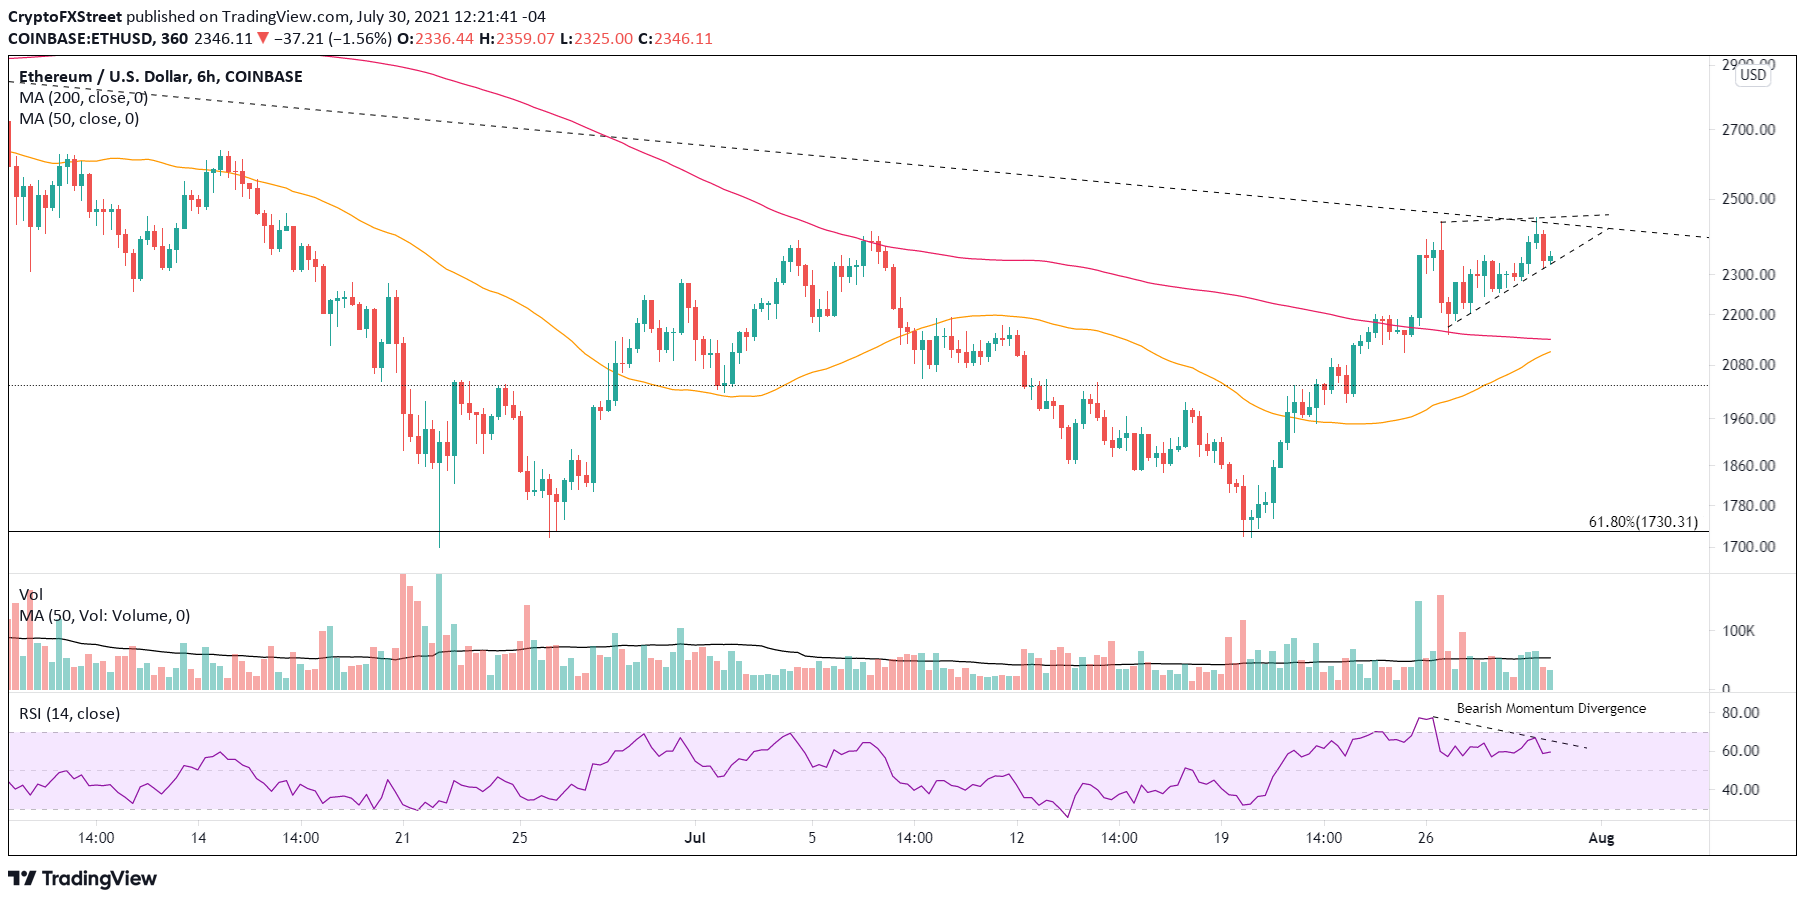
ETH/USD 6-hour chart
Ethereum price is afforded a tremendous layer of support, framed by the 2020 ascending trend line, the 200-day SMA at $2,132 and the 50-day SMA at $2,140. The range is strengthened by the February high of $2,041, providing a secure position for ETH.
Suppose Ethereum price fails to bottom at the February high. In that case, it will raise the probability of a retest of the July low of $1,720 and possibly a breakdown of the triangle’s horizontal support line.
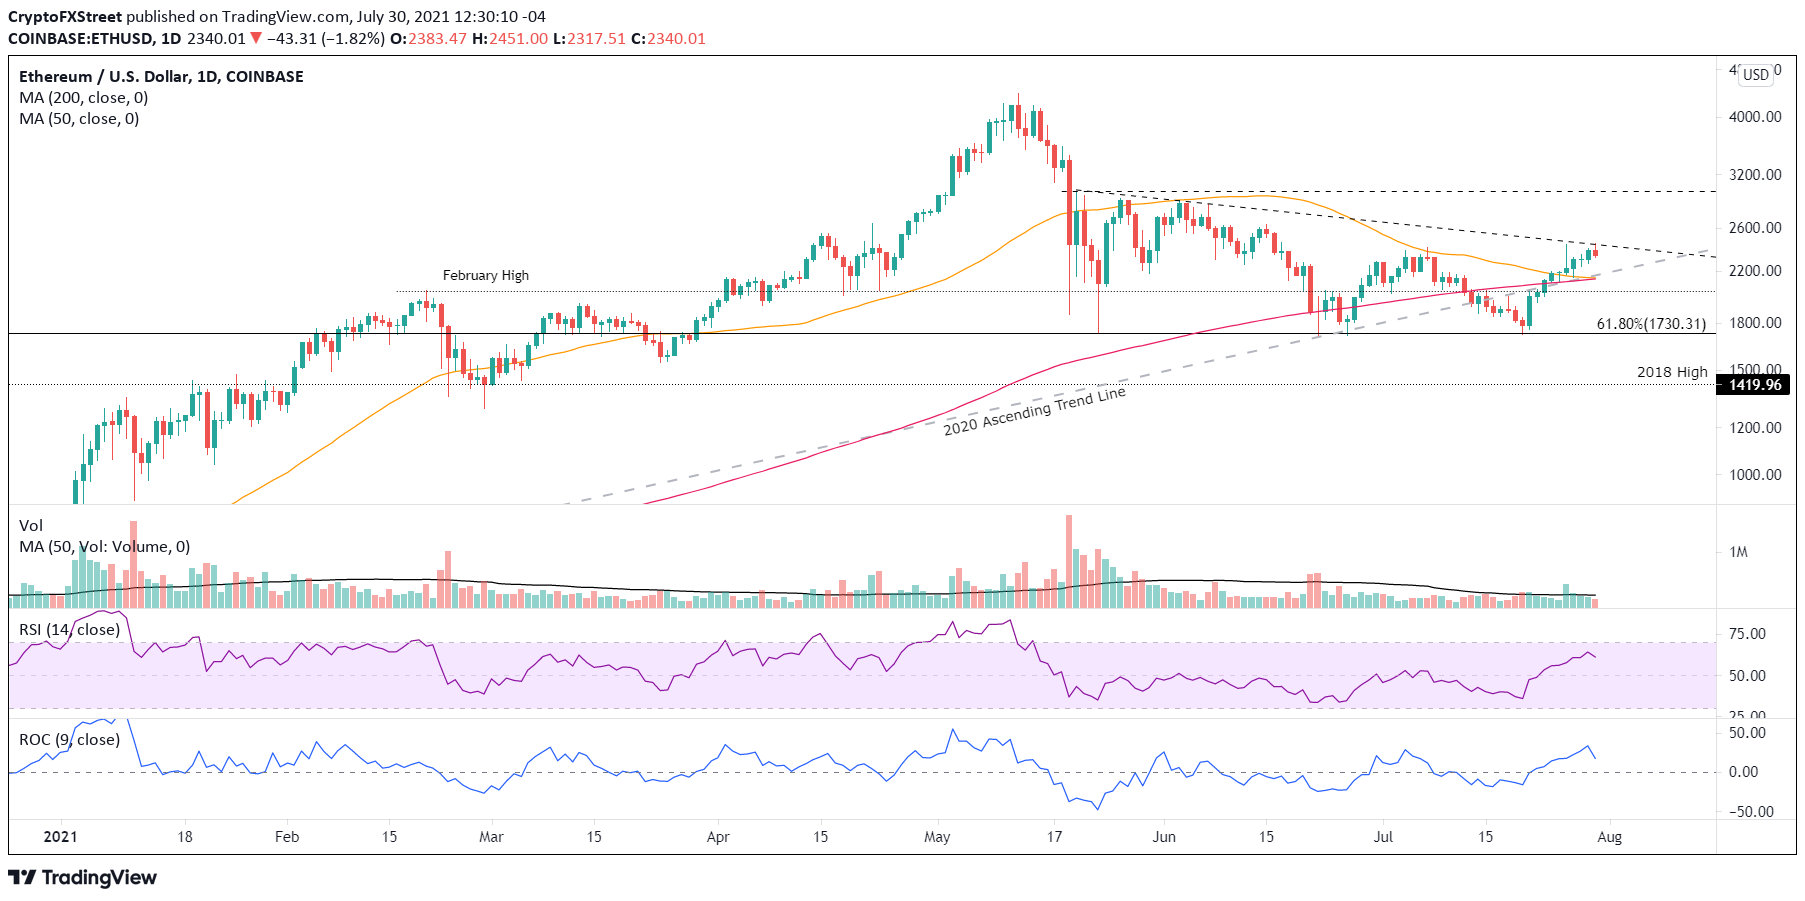
ETH/USD daily chart
A continuation of the rally above the upper trend line of the descending triangle should not face any resistance until a cluster of highs just above $2,900.
Here, FXStreet's analysts evaluate where ETH could be heading next as it looks primed for higher highs.
XRP price close to shining again
XRP price traveled 42% over the previous nine trading days, placing Ripple at the convergence of the 200-day SMA with the neckline of a multi-year inverse head-and-shoulders pattern at $0.772. In the process, the international settlements token triggered a double bottom pattern established by the June and July lows. The fracturing of several resistance levels leaves XRP price shining again and at the threshold of a big opportunity.
The measured move of the double bottom is nearly 30%, taking XRP price to $0.953 based on the double bottom trigger of $0.733. The target falls short of the imposing $1.00 and the 38.2% retracement level of the April-June correction at $1.06.
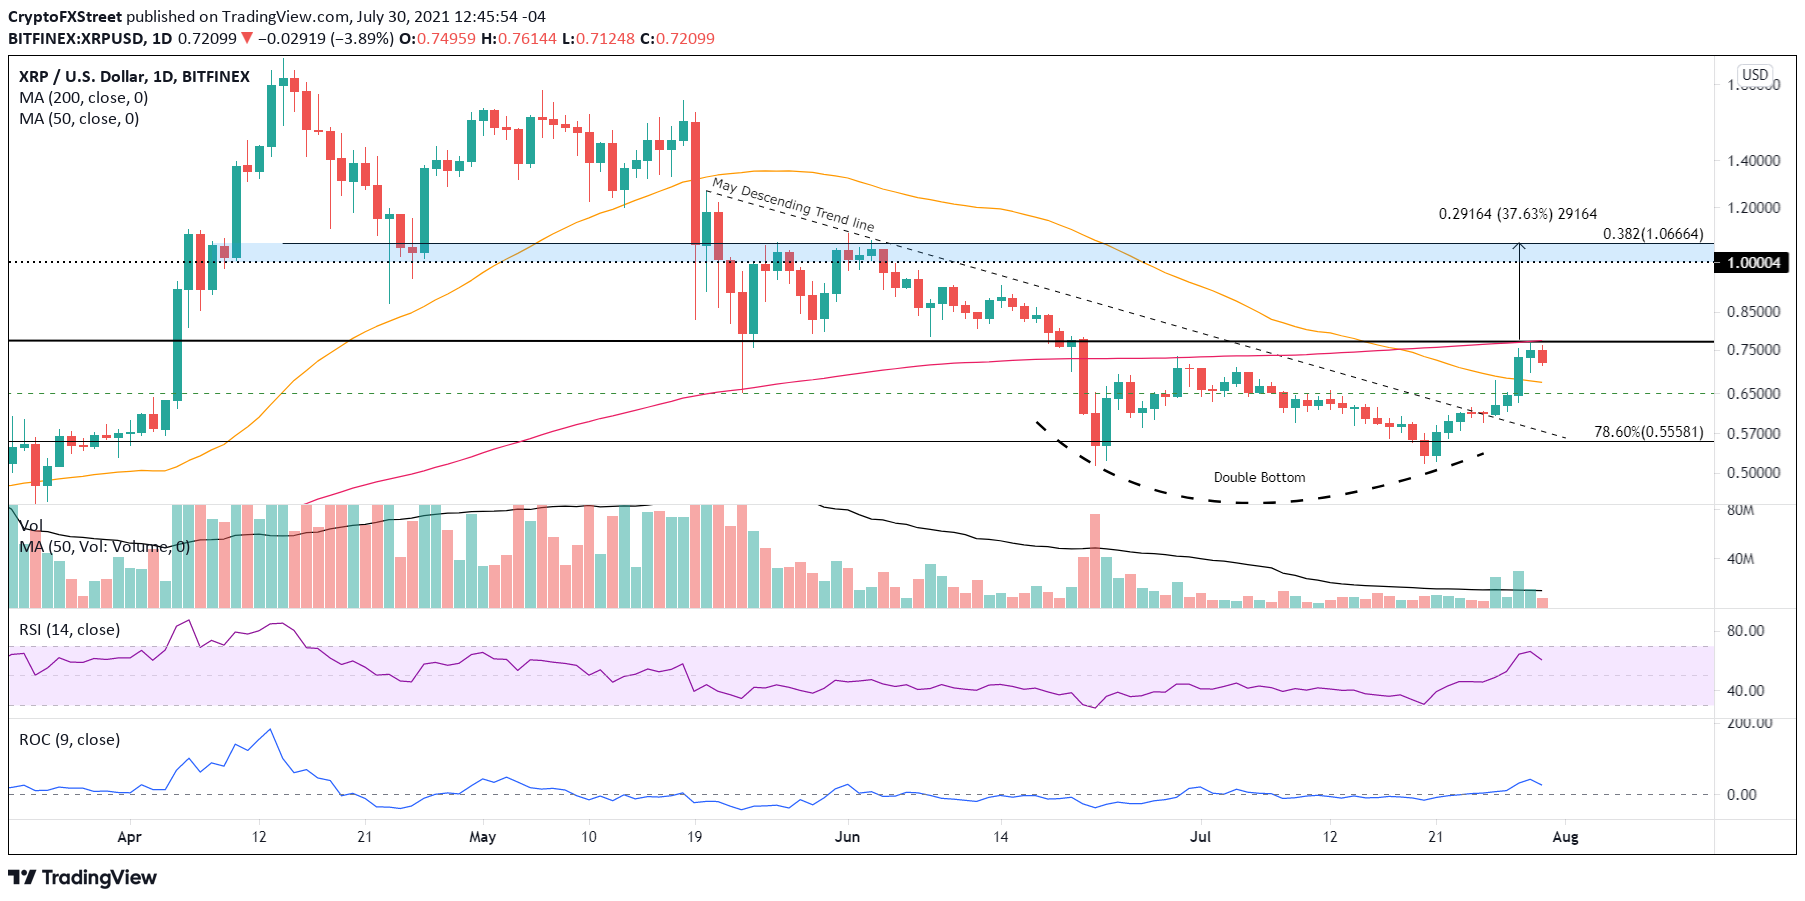
XRP/USD daily chart
To facilitate the continuation of the rally, XRP price should hold the 50-day SMA at $0.673 during consolidation and, at worst, the May 23 low of $0.652. Any weakness below the May 23 low would lead to a quick drop to $0.555 or lower.
After the explosive rally off the July lows, the major cryptocurrencies are well-positioned to continue their advances if the upcoming consolidations are not aggressive. Nevertheless, the easy money has been made, and each cryptocurrency is now confronted with a trend-determining resistance area that will test investors’ resolve moving forward.
Here, FXStreet's analysts evaluate where Ripple could be heading next as it advances further.
Author

Sheldon McIntyre, CMT
Independent Analyst
Sheldon has 24 years of investment experience holding various positions in companies based in the United States and Chile. His core competencies include BRIC and G-10 equity markets, swing and position trading and technical analysis.


