Top 3 Price Prediction Bitcoin, Ethereum, Ripple: BTC energizes risk-on narrative with longest winning streak in 2021
- Bitcoin price continues to surge, reaching eight consecutive up days and the best eight-day return since February.
- Ethereum price climbs over 27% over the last eight days, suggesting a pause in the rally very soon.
- XRP price briefly asserts strength above descending parallel channel before reversing from the 200-day simple moving average (SMA).

Bitcoin price approaches the fierce resistance between $41,300 and $42,600 while Ethereum price continues to hold critical resistance and XRP price approaches a double-digit gain today.
Bitcoin price impulsiveness solidifies a firm bottom
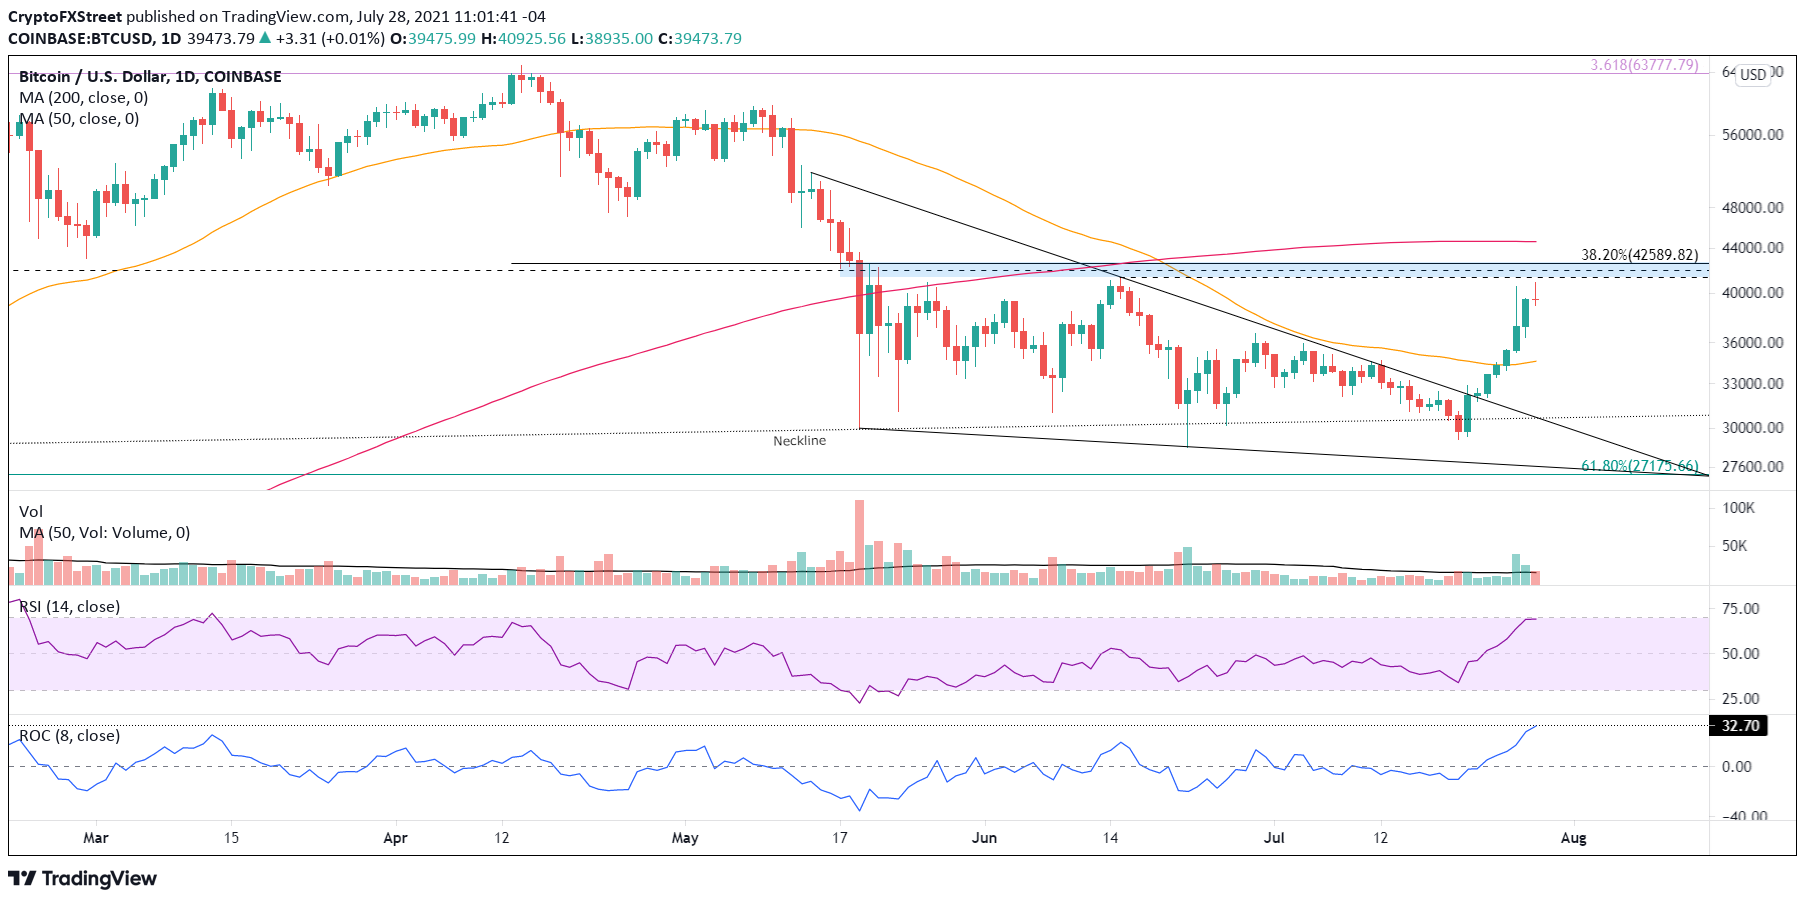
Bitcoin price is on pace to close with eight consecutive up days for the first time since December 2020 and has registered an eight-day return of 33% at the time of writing, marking the best gain since the February breakout from a minor cup base. Moreover, the sharpness of the rebound has pushed the daily Relative Strength Index (RSI) close to an overbought reading for the first time since March.
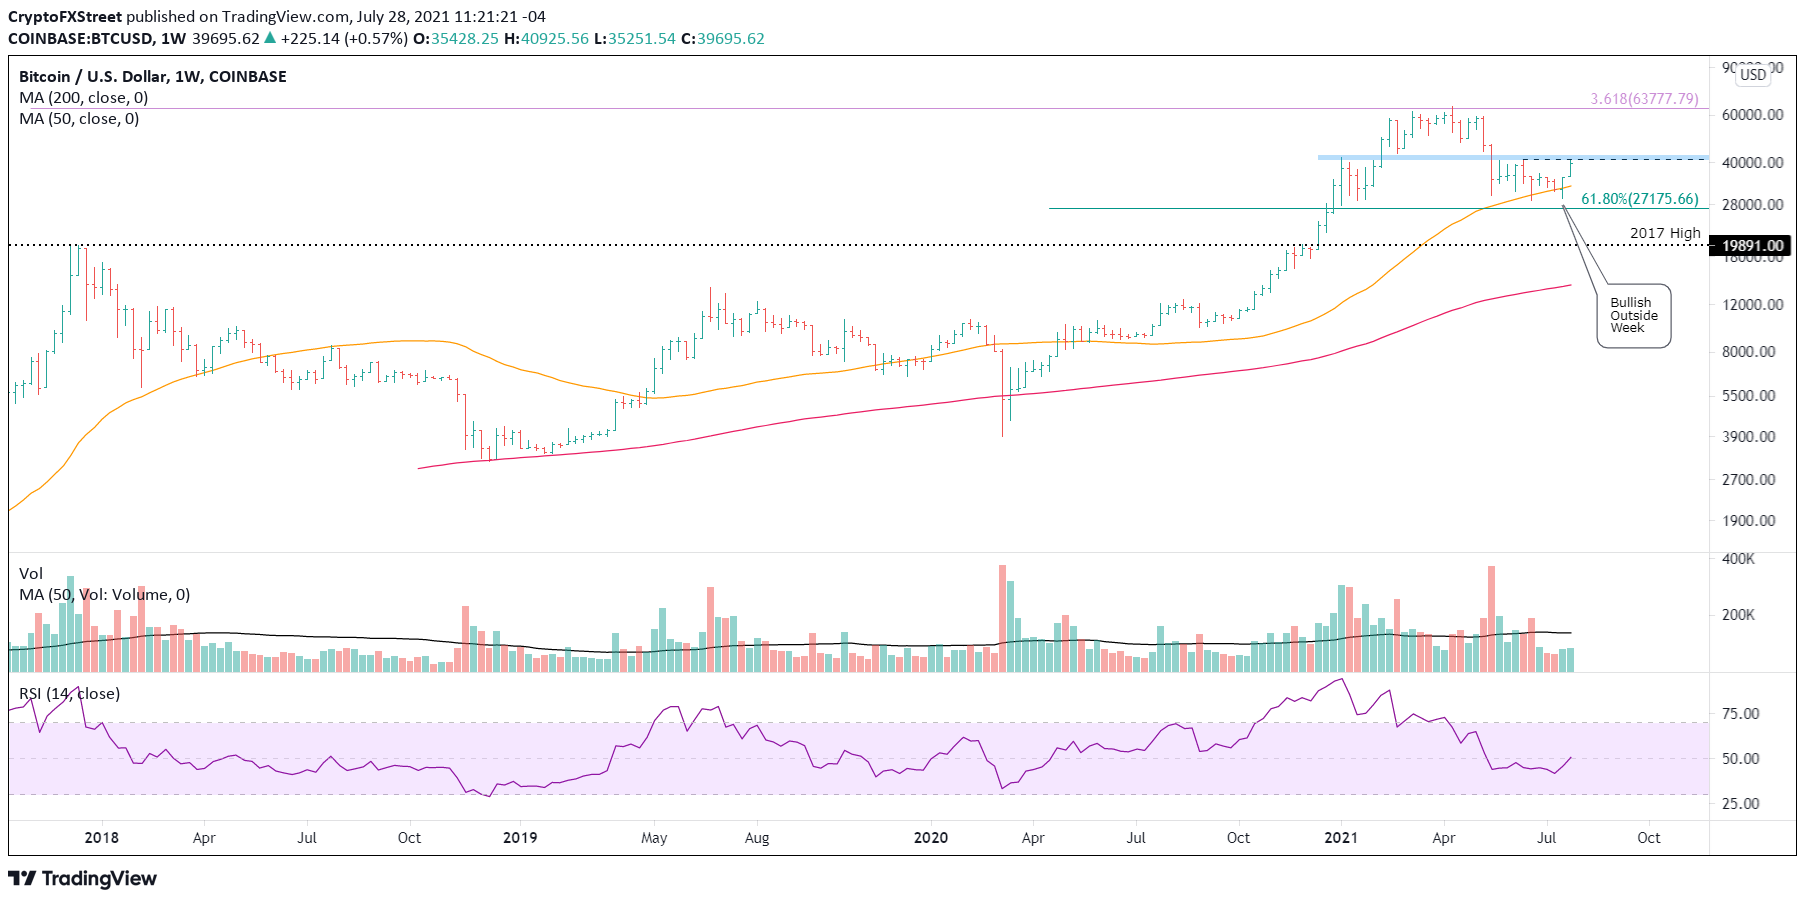
The remarkable rise began with a brief drop below the psychologically important $30,000 and the neckline of a multi-month head-and-shoulders top that was quickly reversed, driving Bitcoin price to confirm a breakout from a falling wedge pattern on July 22. The result was a bullish engulfing week on the bar charts at the 50-week sma, preparing BTC for the sling-shot higher this week.
The quickness and magnitude of the burst higher has instigated a wave of short-covering that has put Bitcoin price near the imposing resistance formed by the June 15 high of $41,322, the January high of $41,986 and the 38.2% Fibonacci retracement of the April-June correction at $42,589. Reinforcing the resistance range is the strategically important 200-day SMA at $44,644.
BTC/USD daily chart
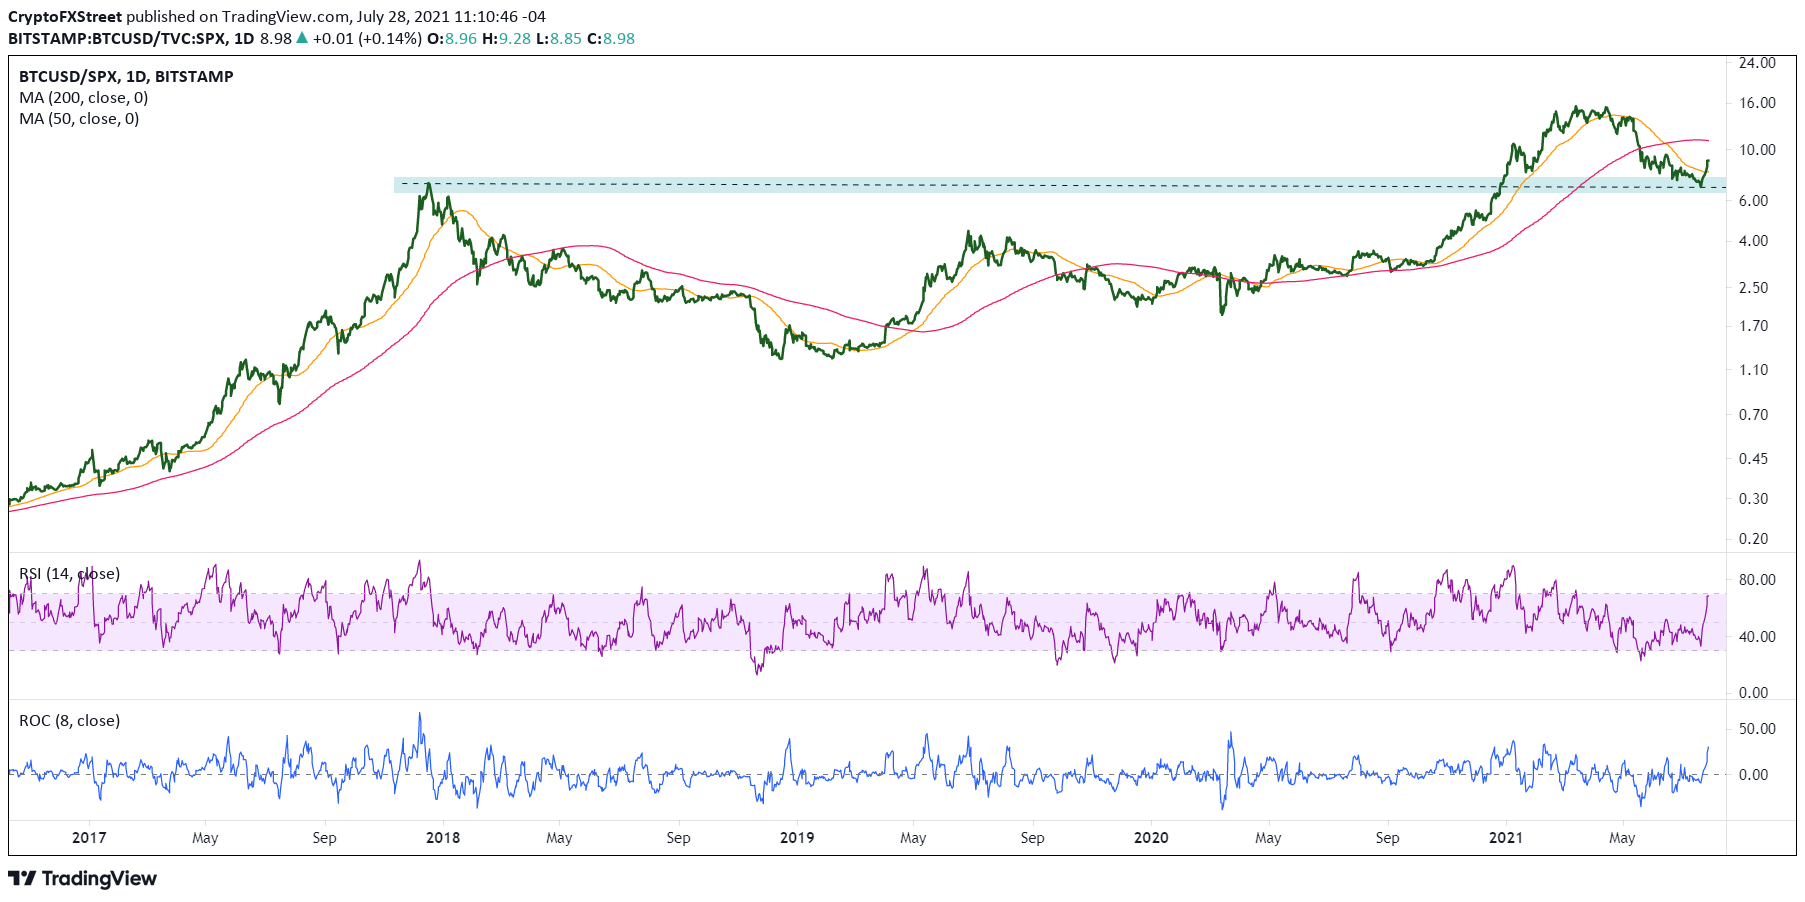
On a comparative basis, Bitcoin price has notably outperformed the S&P 500 after striking support at the 2017 high on July 20, highlighting the interest of investment capital to pursue more aggressive risk-on assets.
The duration of the outperformance is the longest since February, again expressing the persistence of the bid in higher risk-on investment opportunities.
BTCUSD/SPX daily chart
The impulsive thrust off the July low points to a departure from other rebounds during this correction in terms of magnitude and relentless momentum that is supported by improved volume totals. It was one of the few instances when Bitcoin rallied by 33% over eight days, and it occurred off a low, not during an advance. Of note is the March 2020 low. BTC leaped 34% over an eight-day period, laying the groundwork for the historic advance.
Moreover, the rally gains importance since it originated from the 50-week SMA and 12-month SMA, broke out from a bullish falling wedge pattern and was confirmed with the bullish outside week this past week.
BTC/USD weekly chart
With Bitcoin price now knocking on the door of resistance, it is imperative to note the support levels briefly. The first layer of support is the June 29 high of $36,675, followed by the 50-day SMA at $38,220, yielding a 13% decline from the current price. It would not disrupt the bullish intentions of BTC proclaimed by the flagship cryptocurrency over the last eight days.
A drop below the moving average on a daily closing basis does introduce concern and leaves Bitcoin price vulnerable to a test of the upper trendline of the falling wedge and the neckline. Any further weakness below those levels confirms a dead cat bounce and a revival of the corrective process.
Here, FXStreet's analysts evaluate where BTC could be heading next as it seems bound for a rebound before capitulation.
Ethereum price churns higher, but momentum easing
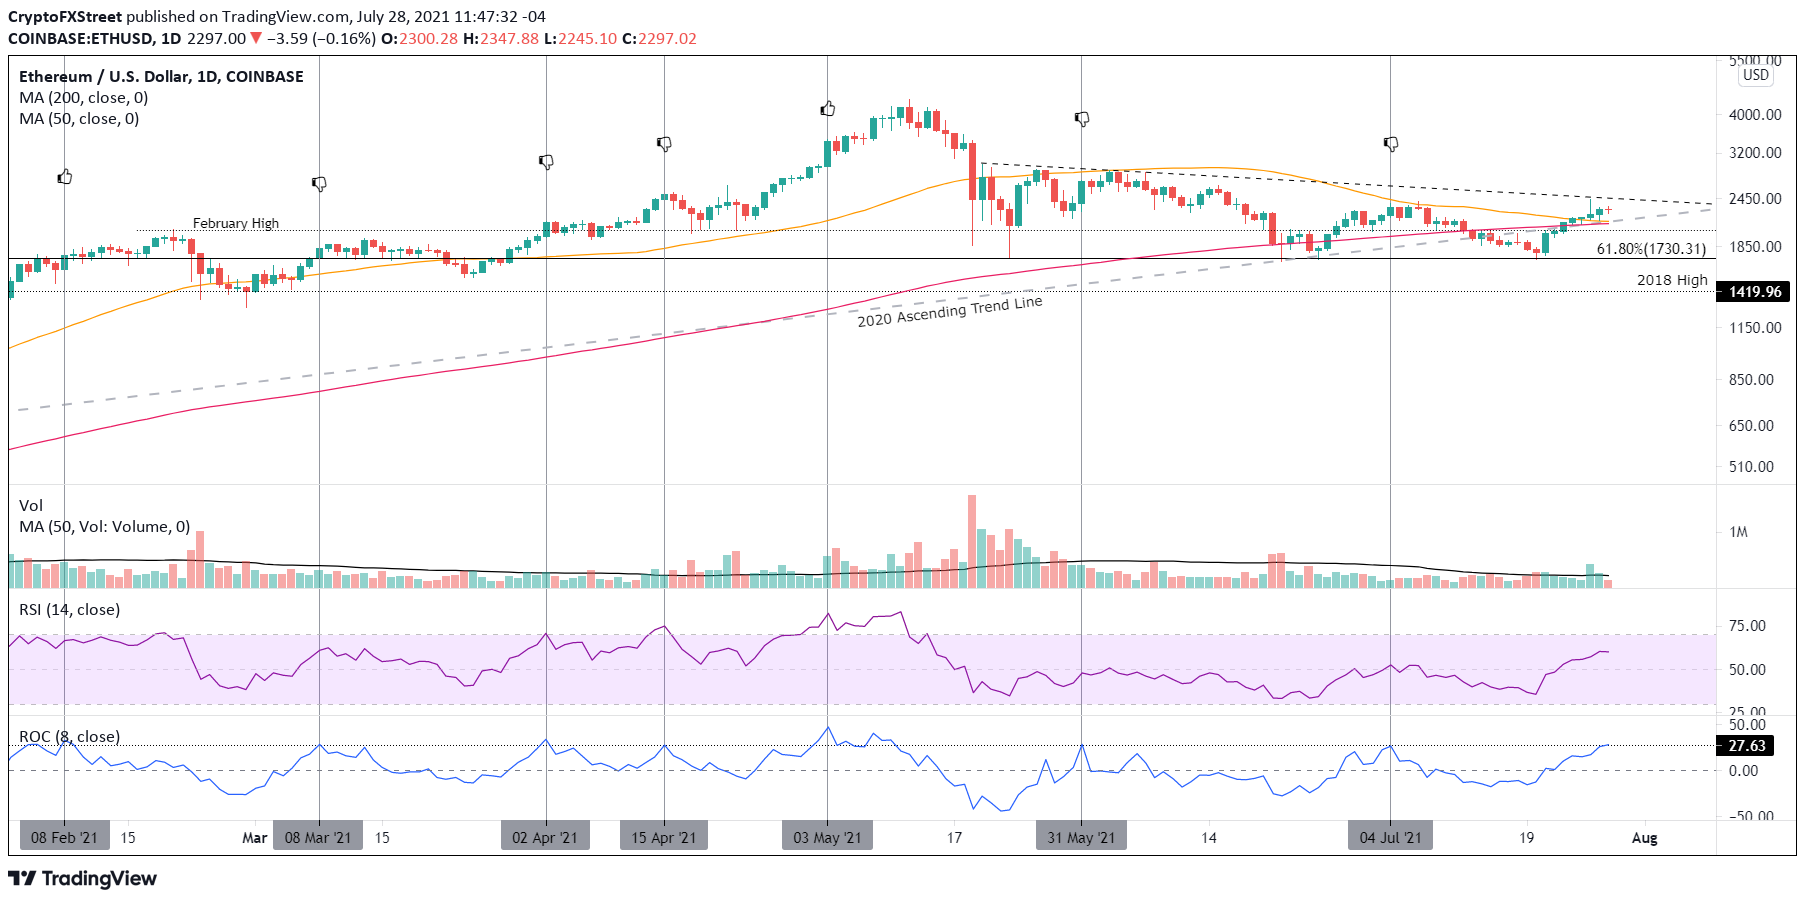
Over the last eight days, Ethereum price has climbed over 28%, notching the largest gain since the rebound off the May low. It is the seventh time that ETH has risen at least 27% over eight days in 2021. The rally paused or flipped lower on five occasions while the other two continued higher, including the last leg into the May high.
Based on that quick examination, there is a high probability that Ethereum price will pause or flip soon, suggesting that a full-fledged test of the descending triangle’s upper trend line will have to wait. If the support framed by the 2020 ascending trend line, the 50-day SMA at $2,147 and the 200-day SMA at $2,120 do hold, the pause or pullback will be minimal and short duration.
If Ethereum price does continue the ascent, it needs a daily close above the descending triangle’s upper trend line at $2,450 before greater bullish outcomes can be projected.
ETH/USD daily chart
Conversely, if Ethereum price cannot hold the support range of the ascending trend line, 50-day SMA and 200-day SMA, it must hold the February high of $2,041. It is a price level that has been influential over the last few months. Below the February high, there is a high probability for ETH to revisit the crucial $1,700.
Relative to Bitcoin, Ethereum price has not performed well over the last four weeks, noting a preference away from altcoins to the pioneer cryptocurrency, at least partly due to greater institutional involvement in BTC.
However, from a larger perspective, the rally from the inverse head-and-shoulders pattern remains intact.
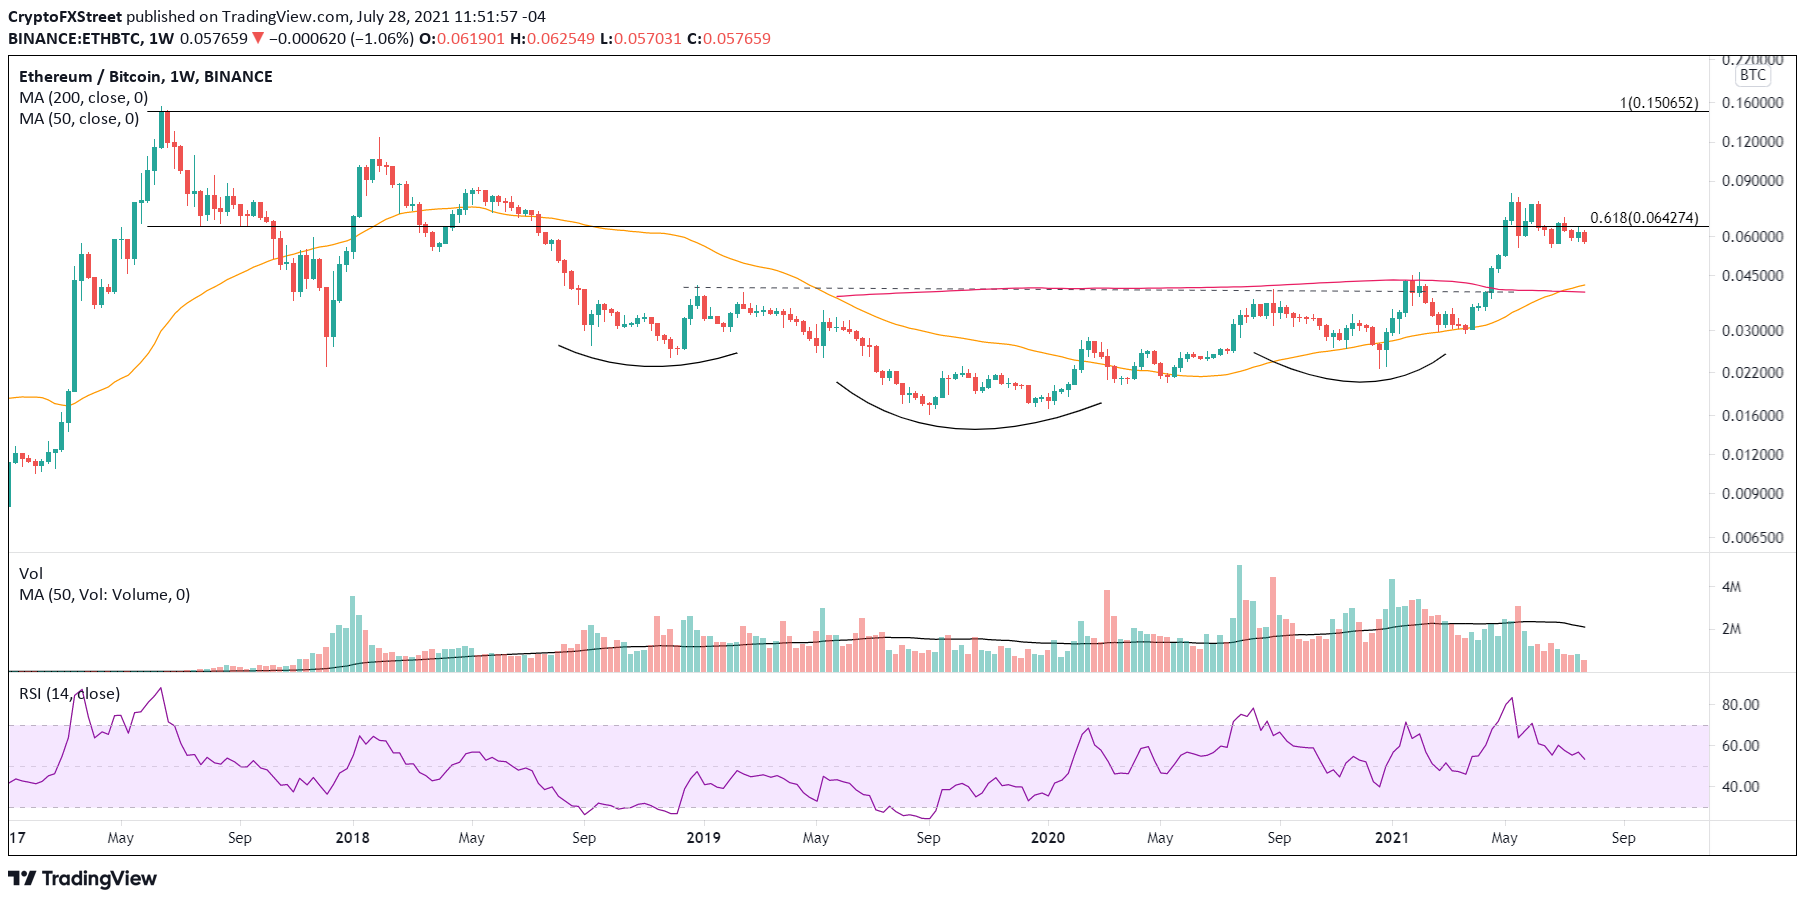
ETH/BTC weekly chart
Here, FXStreet's analysts evaluate where ETH could be heading next as it looks primed for higher highs.
XRP price attempting to break through after weeks of stagnation
XRP price remains locked in a demanding range between $0.555 and $0.775, but Ripple is making progress with a 34% gain over the last eight days. It has bested the midline of the descending parallel channel, the May descending trend line, the sturdy resistance at the May low of $0.652 and now is trying to close above the 50-day SMA at $0.679 and potentially the upper line of the channel at $0.720.
As previous Top 3 publications remarked, a daily close above $0.775 should unleash XRP price to a quick rally to $1.00, where resistance was uncovered in late May and early June. The breakout would carry a gain of 29% from $0.775.
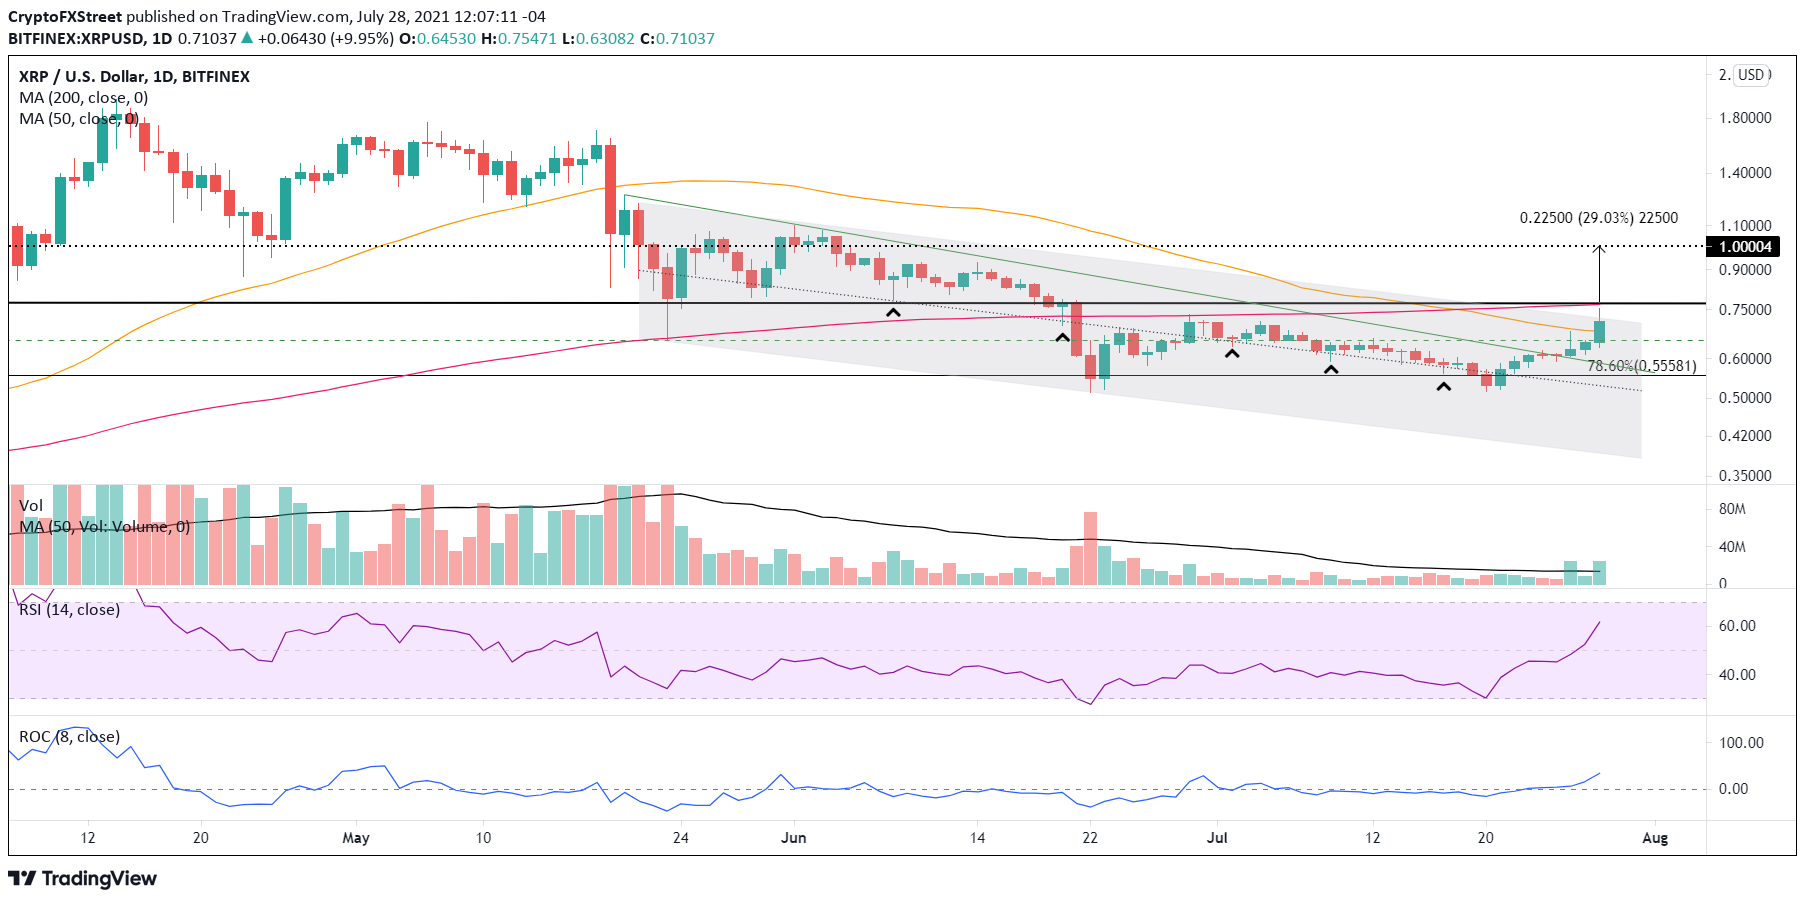
XRP/USD daily chart
XRP price needs to hold the May descending trend line on any pullback. If unable, Ripple will fall to at least the channel’s midline around $0.524 or the July 20 low of $0.516. Any further weakness will push the international settlements token to the lower line of the channel near $0.387.
Overall, the last week has marked a substantial departure for Bitcoin price, bringing impulsiveness consistent with firm bottoms and not dead cat bounces. Technical challenges now await the rally, but that is inevitable after a significant correction.
As for the altcoins, they have been lagging Bitcoin, but Ethereum and Ripple have made technical progress that should enable them to absorb any corrective pressures that will emerge. It fortifies the cryptocurrency complex and raises the potential for a collective rally in the weeks and months ahead.
Here, FXStreet's analysts evaluate where Ripple could be heading next as it advances further.
Author

Sheldon McIntyre, CMT
Independent Analyst
Sheldon has 24 years of investment experience holding various positions in companies based in the United States and Chile. His core competencies include BRIC and G-10 equity markets, swing and position trading and technical analysis.



