Top 3 Price Prediction Bitcoin, Ethereum, Ripple: Crypto forms higher lows, begin new bull market
- Bitcoin price action begins a move that will confirm a new bull market.
- Ethereum price rises above key Volume Profile and Ichimoku resistance.
- XRP price achieves bullish Ichimoku breakout conditions.

Bitcoin price sees bulls swallow up the entire trading range of the past eight days. Ethereum price hits $3,000 and extends the intraday bull rally above $3,100. XRP price prepares for launch to hit $1.00.
Bitcoin price readies for spike towards $50,000
Bitcoin price recently completed an Ichimoku gap closure between the bodies of the daily candlesticks and the Tenkan-Sen. This gap-fill between the candlestick bodies and the Tenkan-Sen returned price action to a level of equilibrium in the Ichimoku system.
There were two scenarios for Bitcoin price identified on Friday. The first was a return to equilibrium over time, involving a sideways trading range between $43,000 and $44,000. The second and most likely was that Bitcoin price returned to the Tenken-Sen at $41,000. The latter of the two scenarios played out for Bitcoin price.
Looking forward to February 20, the top of the Ichimoku Cloud (Senkou Span B) falls to $42,500 from the current $49,500. As a result, it is increasingly likely that Bitcoin could trade sideways between the 61.8% Fibonacci retracement at $41,000 and the 2022 Volume Point Of Control at $43,000 until February 20 before positioning for an Ideal Bullish Ichimoku Breakout above the Cloud.
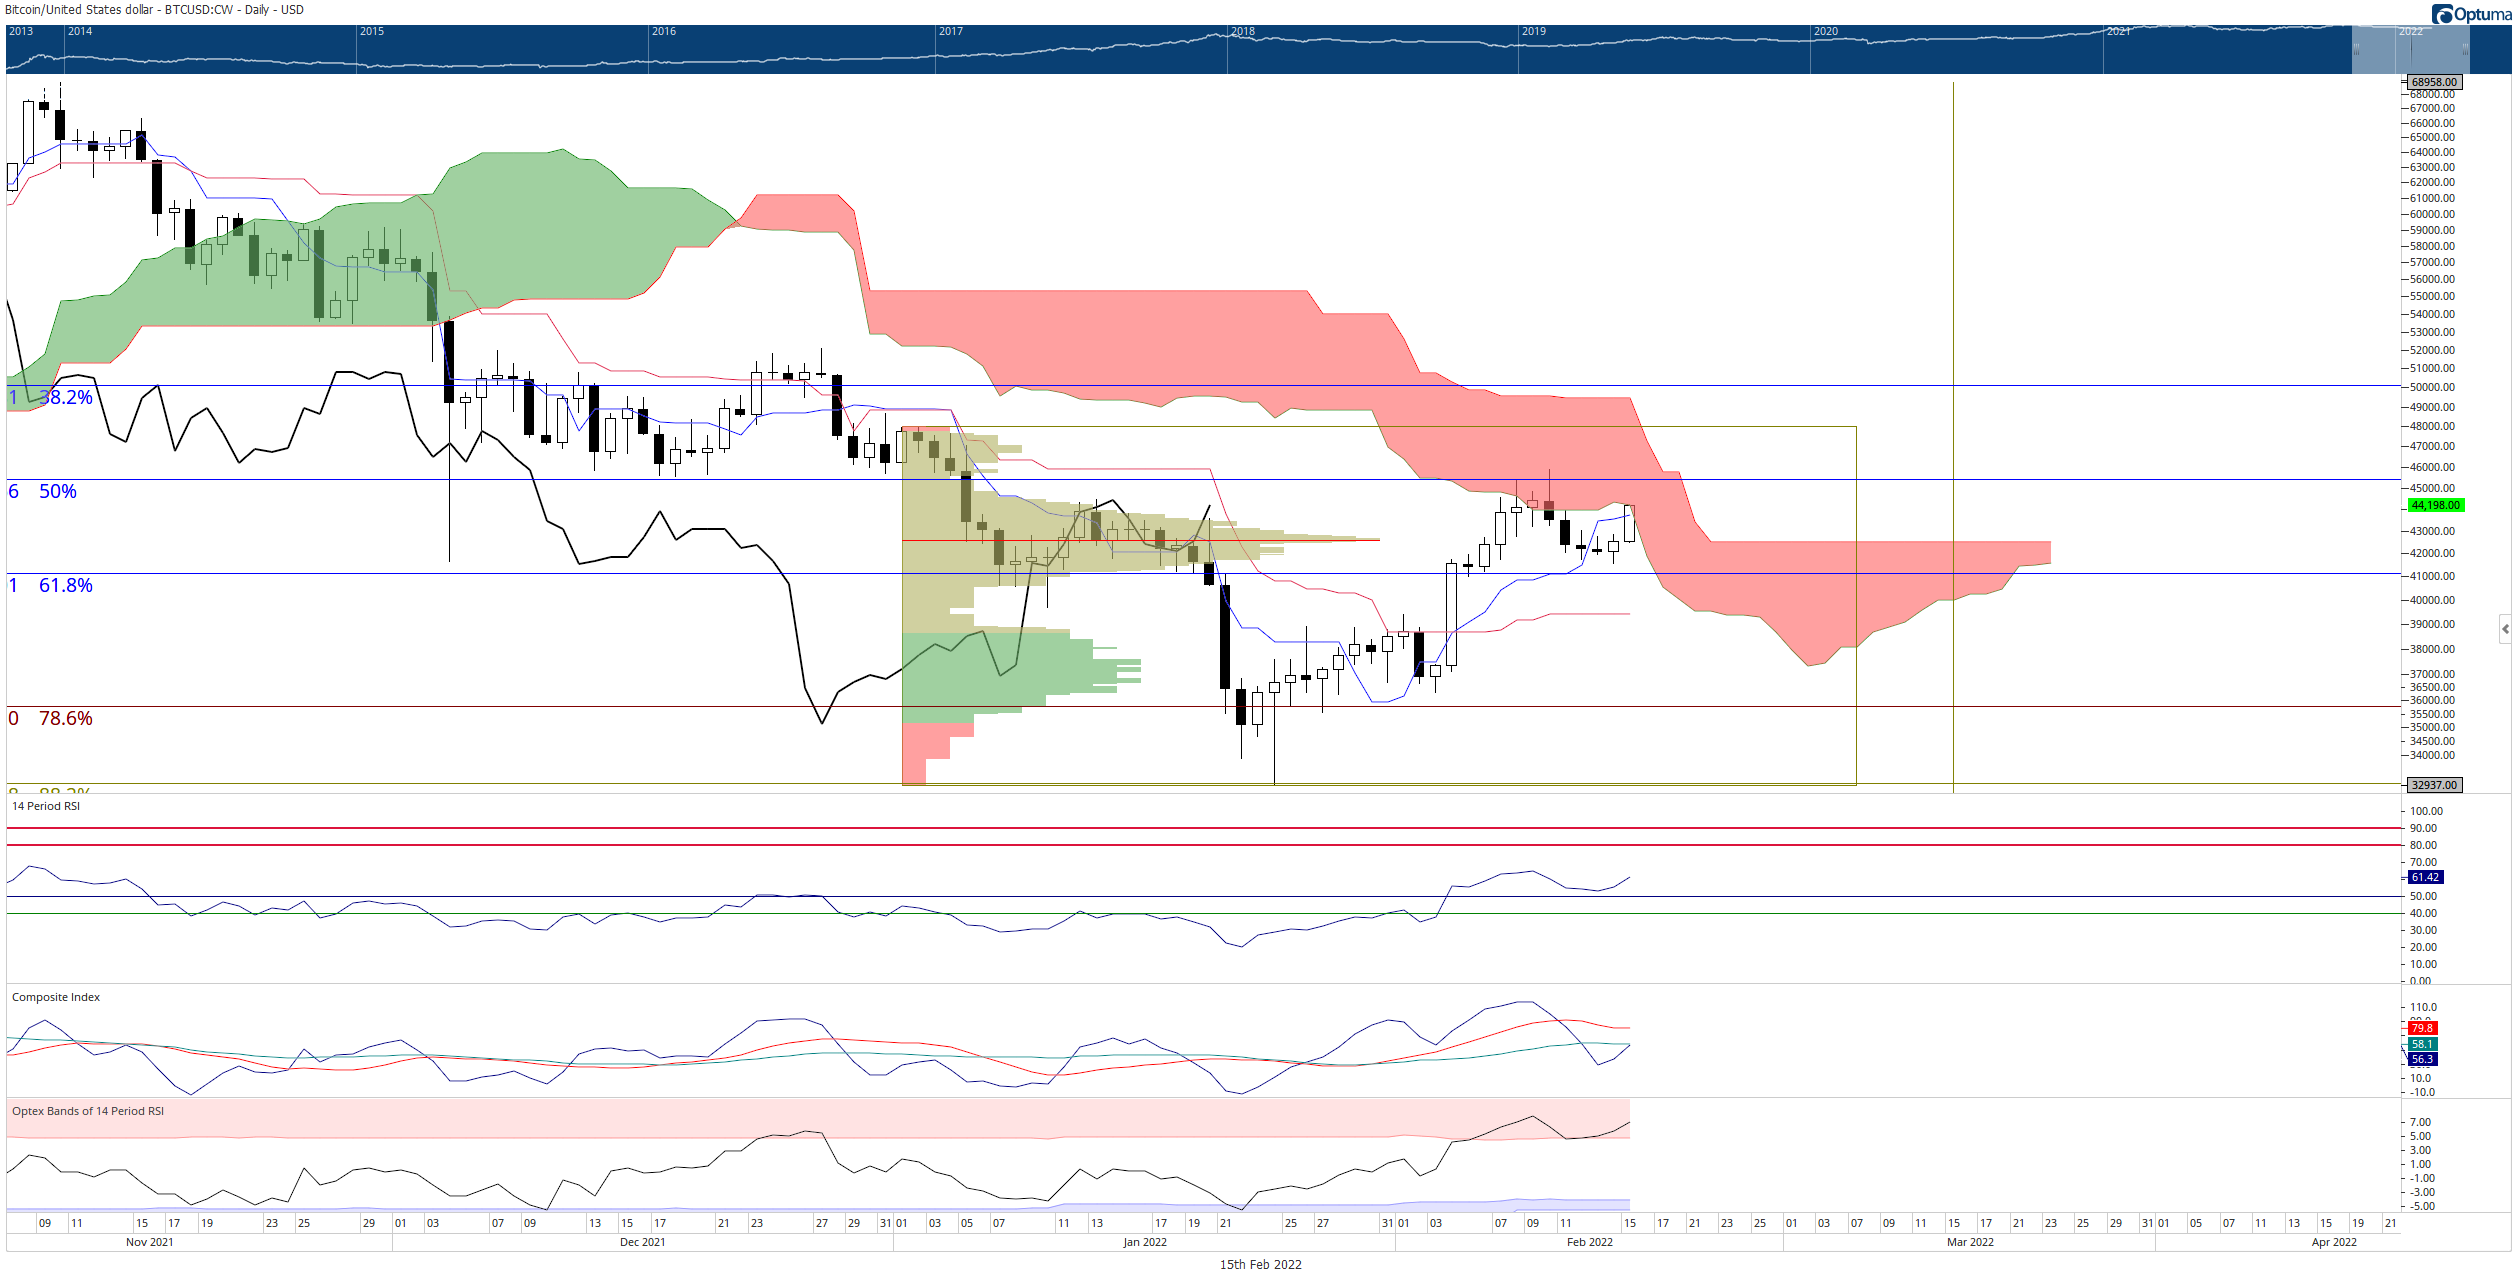
BTC/USD Daily Ichimoku Kinko Hyo Chart
However, downside risks remain. On the daily chart, there is one final Ichimoku support level – the Kijun-Sen at $39,400. If Bitcoin price closed below that level, a return to the 2022 lows near $33,000 is almost inevitable.
Ethereum price regains critical $3,000 level before ETH hits $4,000
Ethereum price action has been highly bullish during the intraday session on Tuesday. While this current early bullish expansion move was not unexpected, there were concerns that it could retrace to the $2,700 value area before beginning a run towards $4,000.
The inverse head-and-shoulders pattern identified on February 12, along with the bullish divergence in Ethereum’s oscillators, all remain in play and structurally unchanged. Etheruem price could dip to the 61.8% Fibonacci retracement at $2,500 before finding a swing low, but it would threaten to cancel the hidden bullish divergence present between the candlestick chart and both the Composite Index and Optex Bands.
The hidden bullish divergence became more extended, enhancing the strength and likelihood of a swing low developing very soon. However, if bulls establish a new swing low in the $2,500 to $2,700 price range, they still need to contend with a massive cluster of resistance in the $3,150 to $3,300 value area. The 2022 Volume Point Of Control, top of the Ichimoku Cloud (Senkou Span B), 38.2% Fibonacci retracement, and lower trendline of a prior bear flag exist within that $3,150 to $3,300 price range.
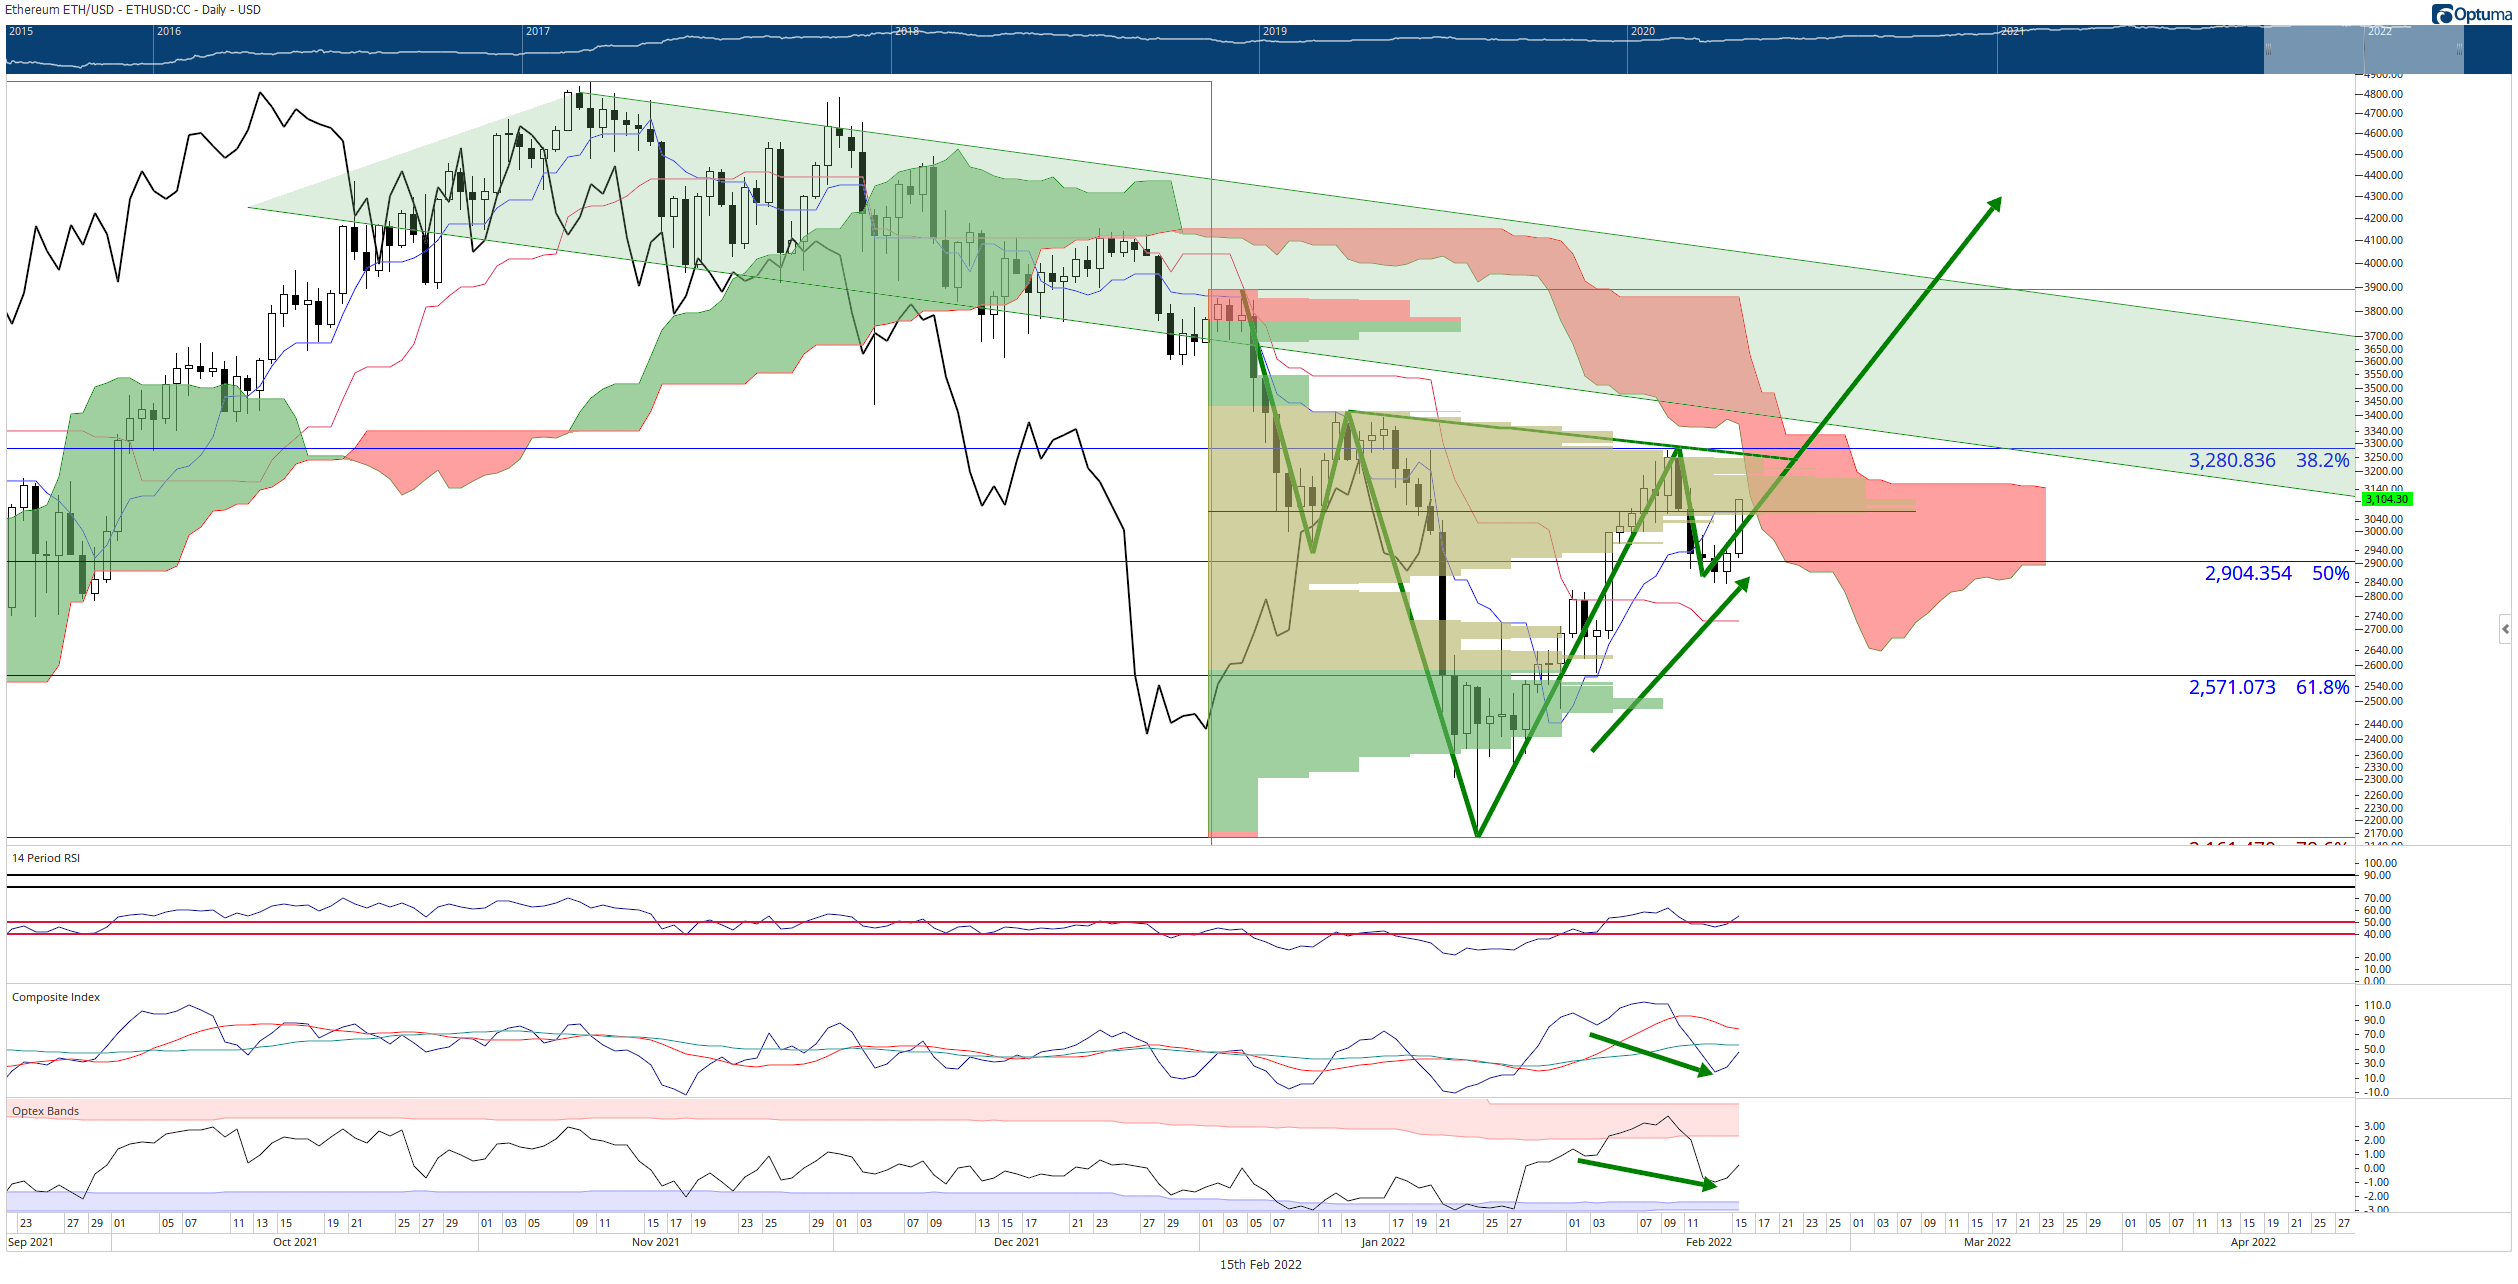
ETH/USD Daily Ichimoku Kinko Hyo Chart
A successful breakout above $3,300 would quickly generate a move to retest $4,000.
Bulls and bears will want to watch for any daily close below the 61.8% Fibonacci retracement at 2,500 as it would signal a highly probable sell-off to retest the 2022 low near $2,100.
XRP price presents buying opportunity before hitting $1.00
XRP price triggered a hypothetical long entry on February 11 but dropped below that level over the past four trading days. However, that prior trade setup is still valid and provides an opportunity for traders who missed it to take advantage of that setup.
The theoretical long opportunity for XRP price was a buy stop order at the three-box reversal, which triggered $0.84. That theoretical long entry is still valid as XRP is currently trading near $0.81. The stop loss is at $0.78, with a profit target at $1.58. Profit-taking will likely occur before the projected profit target, near a former dominant subjective trendline (black diagonal line) around the $1.15 value area.
From an Ichimoku perspective, XRP price is now positioned for an Ideal Bullish Ichimoku Breakout setup. The past two occasions that the Ideal Bullish Ichimoku Breakout setup occurred resulted in a 71% gain (between August 9, 2021, to September 6, 2021) and a 273% gain (March 20, 2021, to April 14, 2021). If bulls can pull off a daily XRP close above the 38.2% Fibonacci retracement at $0.84, the road to $1.00 is all but a done deal.
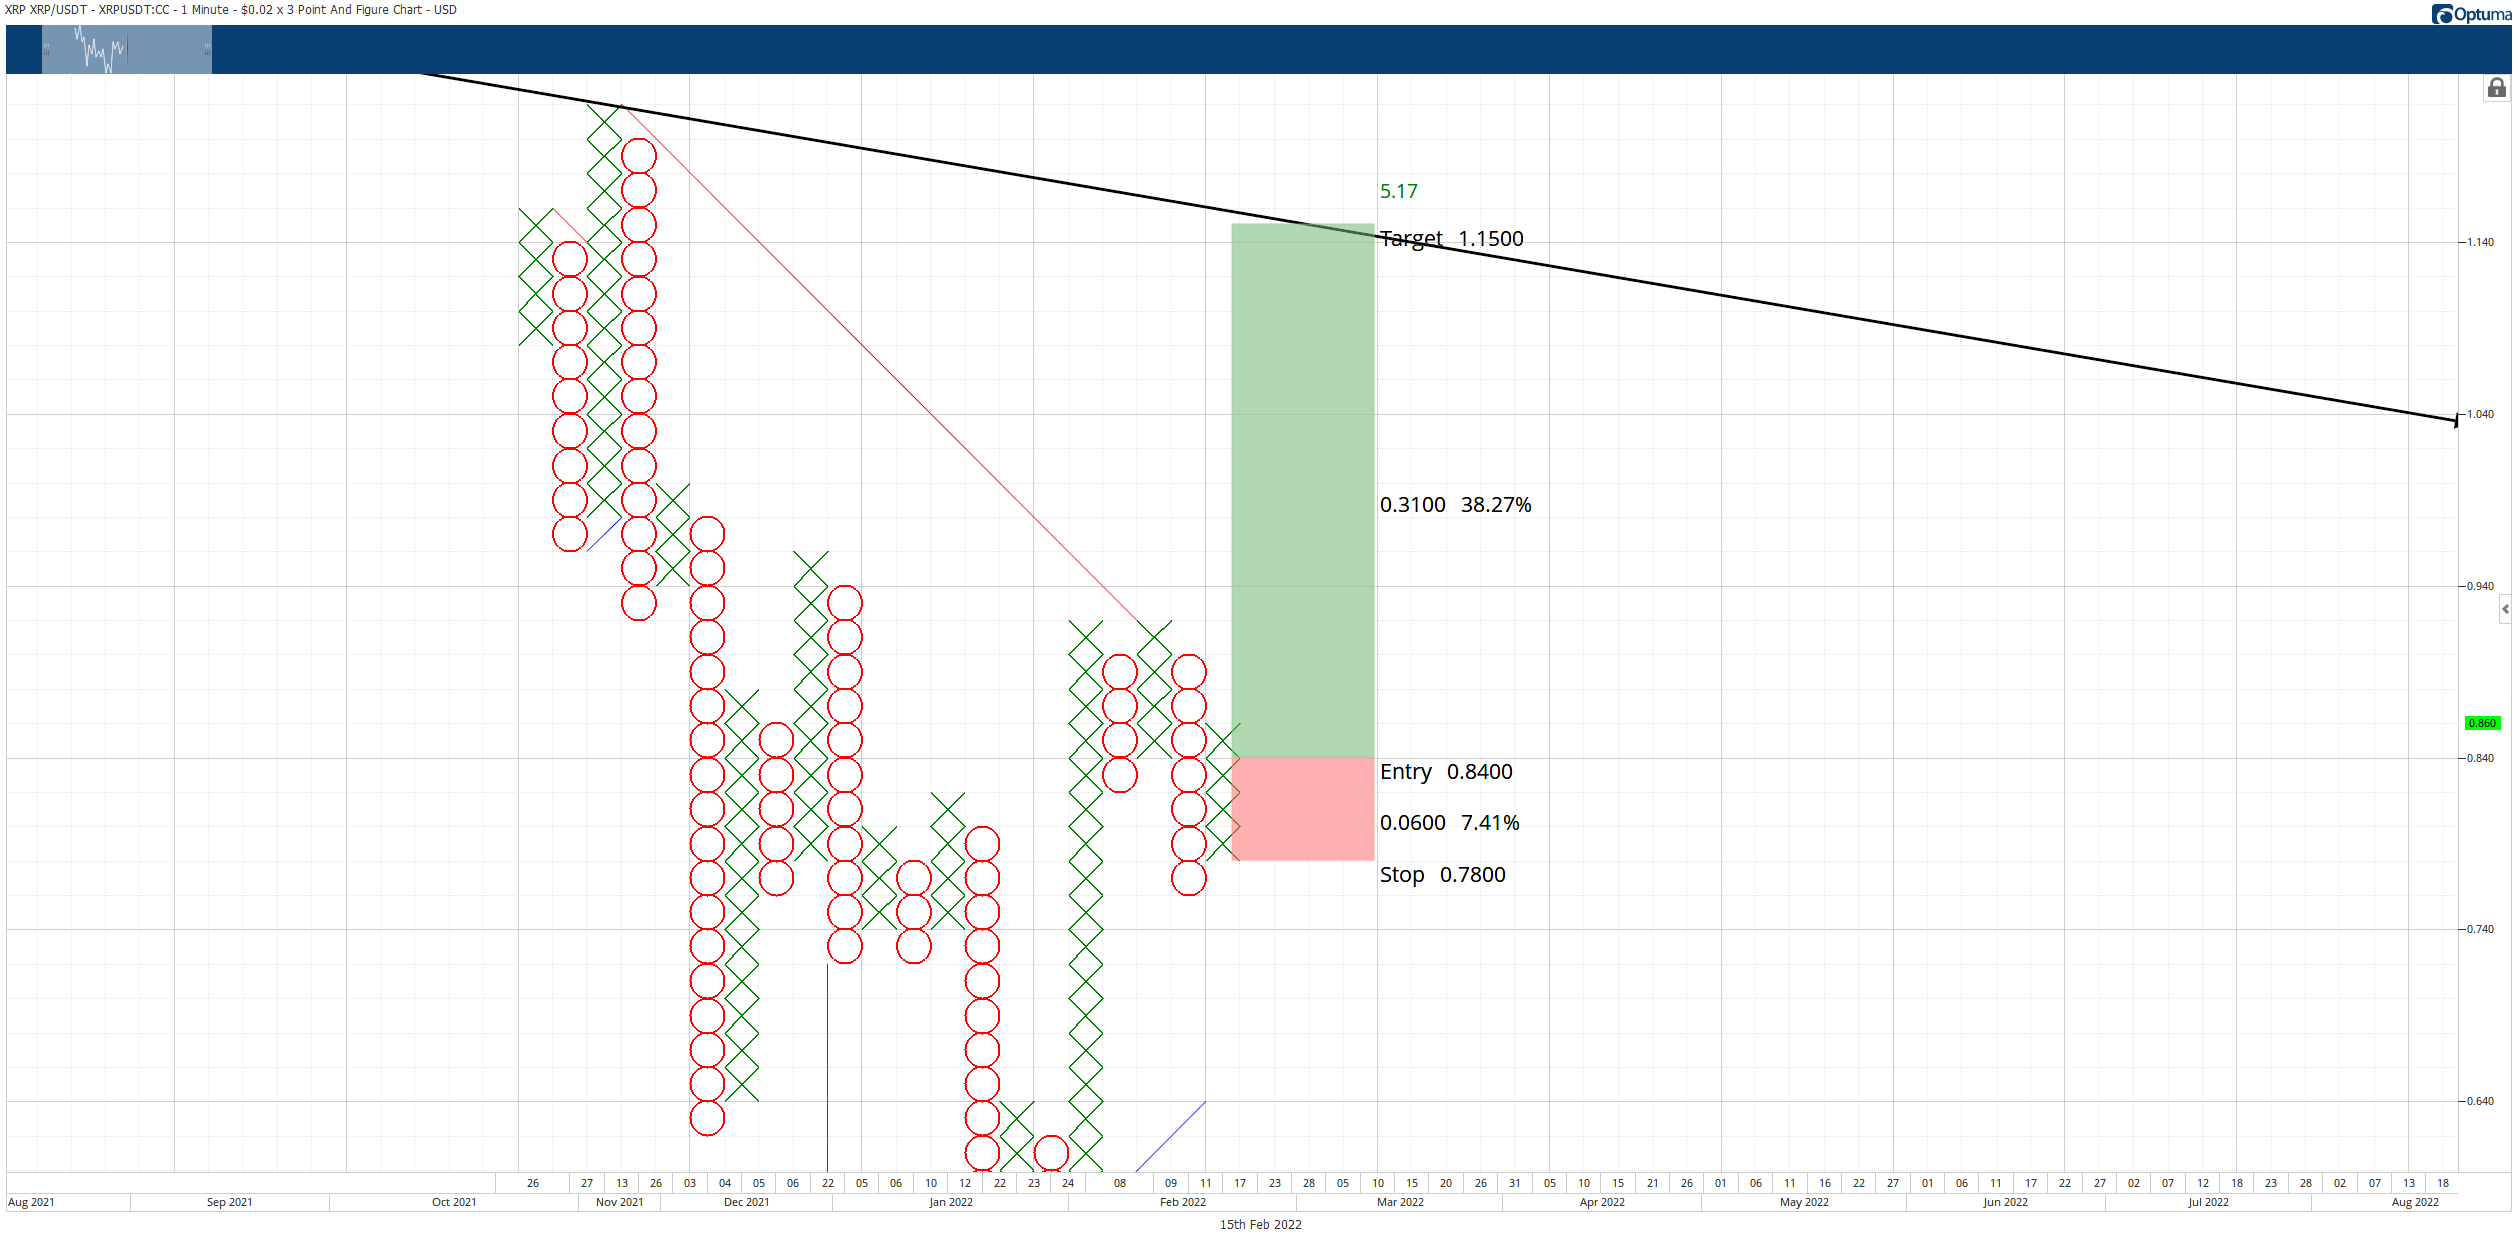
XRP/USD $0.02/3-box Reversal Point and Figure Chart
Downside risks, however, do remain. A daily close below the Kijun-Sen at or below $0.73 would likely indicate a resumption of the prior bear market for XRP and confirm a massive bull trap. Moves exceeding the $0.50 level would be all but a forgone conclusion.
Author

Jonathan Morgan
Independent Analyst
Jonathan has been working as an Independent future, forex, and cryptocurrency trader and analyst for 8 years. He also has been writing for the past 5 years.


