XRP price breaks a bear market trendline, returns Ripple to bull mode
- XRP price recently broke the bear market trendline on its $0.02/3-box reversal Point and Figure chart.
- A prior long trade setup identified on Friday returned to a price level that allows for another entry if it was missed.
- Downside risks exist but are likely limited.

XRP price recently broke the bear market trendline on its $0.02/3-box reversal Point and Figure chart. That break occurred when XRP tagged the $0.92 price level, but it promptly sold off from there.
XRP price experienced a strong bounce on Saturday, extending gains into Sunday
Since converting into a bull market, the first pullback reached a low at $0.75. XRP price was not immune to the selling pressure that affected nearly all risk-on markets after last Thursday’s US CPI data release. However, buyers stepped in and generated a new reversal column of Xs, indicating continued bullish momentum for XRP price.
This past Friday, a bullish entry pattern was developing that looked like a setup for a breakout above a Triple Top pattern. However, it was augmented slightly due to the current O-column being the first reversal column after converting to a bull market. The entry, therefore, was on the three-box reversal, not the breakout above the Triple Top pattern.
The theoretical long opportunity for XRP price was a buy stop order at the three-box reversal, which triggered at $0.84. That theoretical long entry is still valid as XRP is currently trading near $0.81. The stop loss is at $0.78, with a profit target of $1.58. Profit-taking will likely occur before the projected profit target, near a former dominant subjective trendline (black diagonal line) around the $1.15 value area.
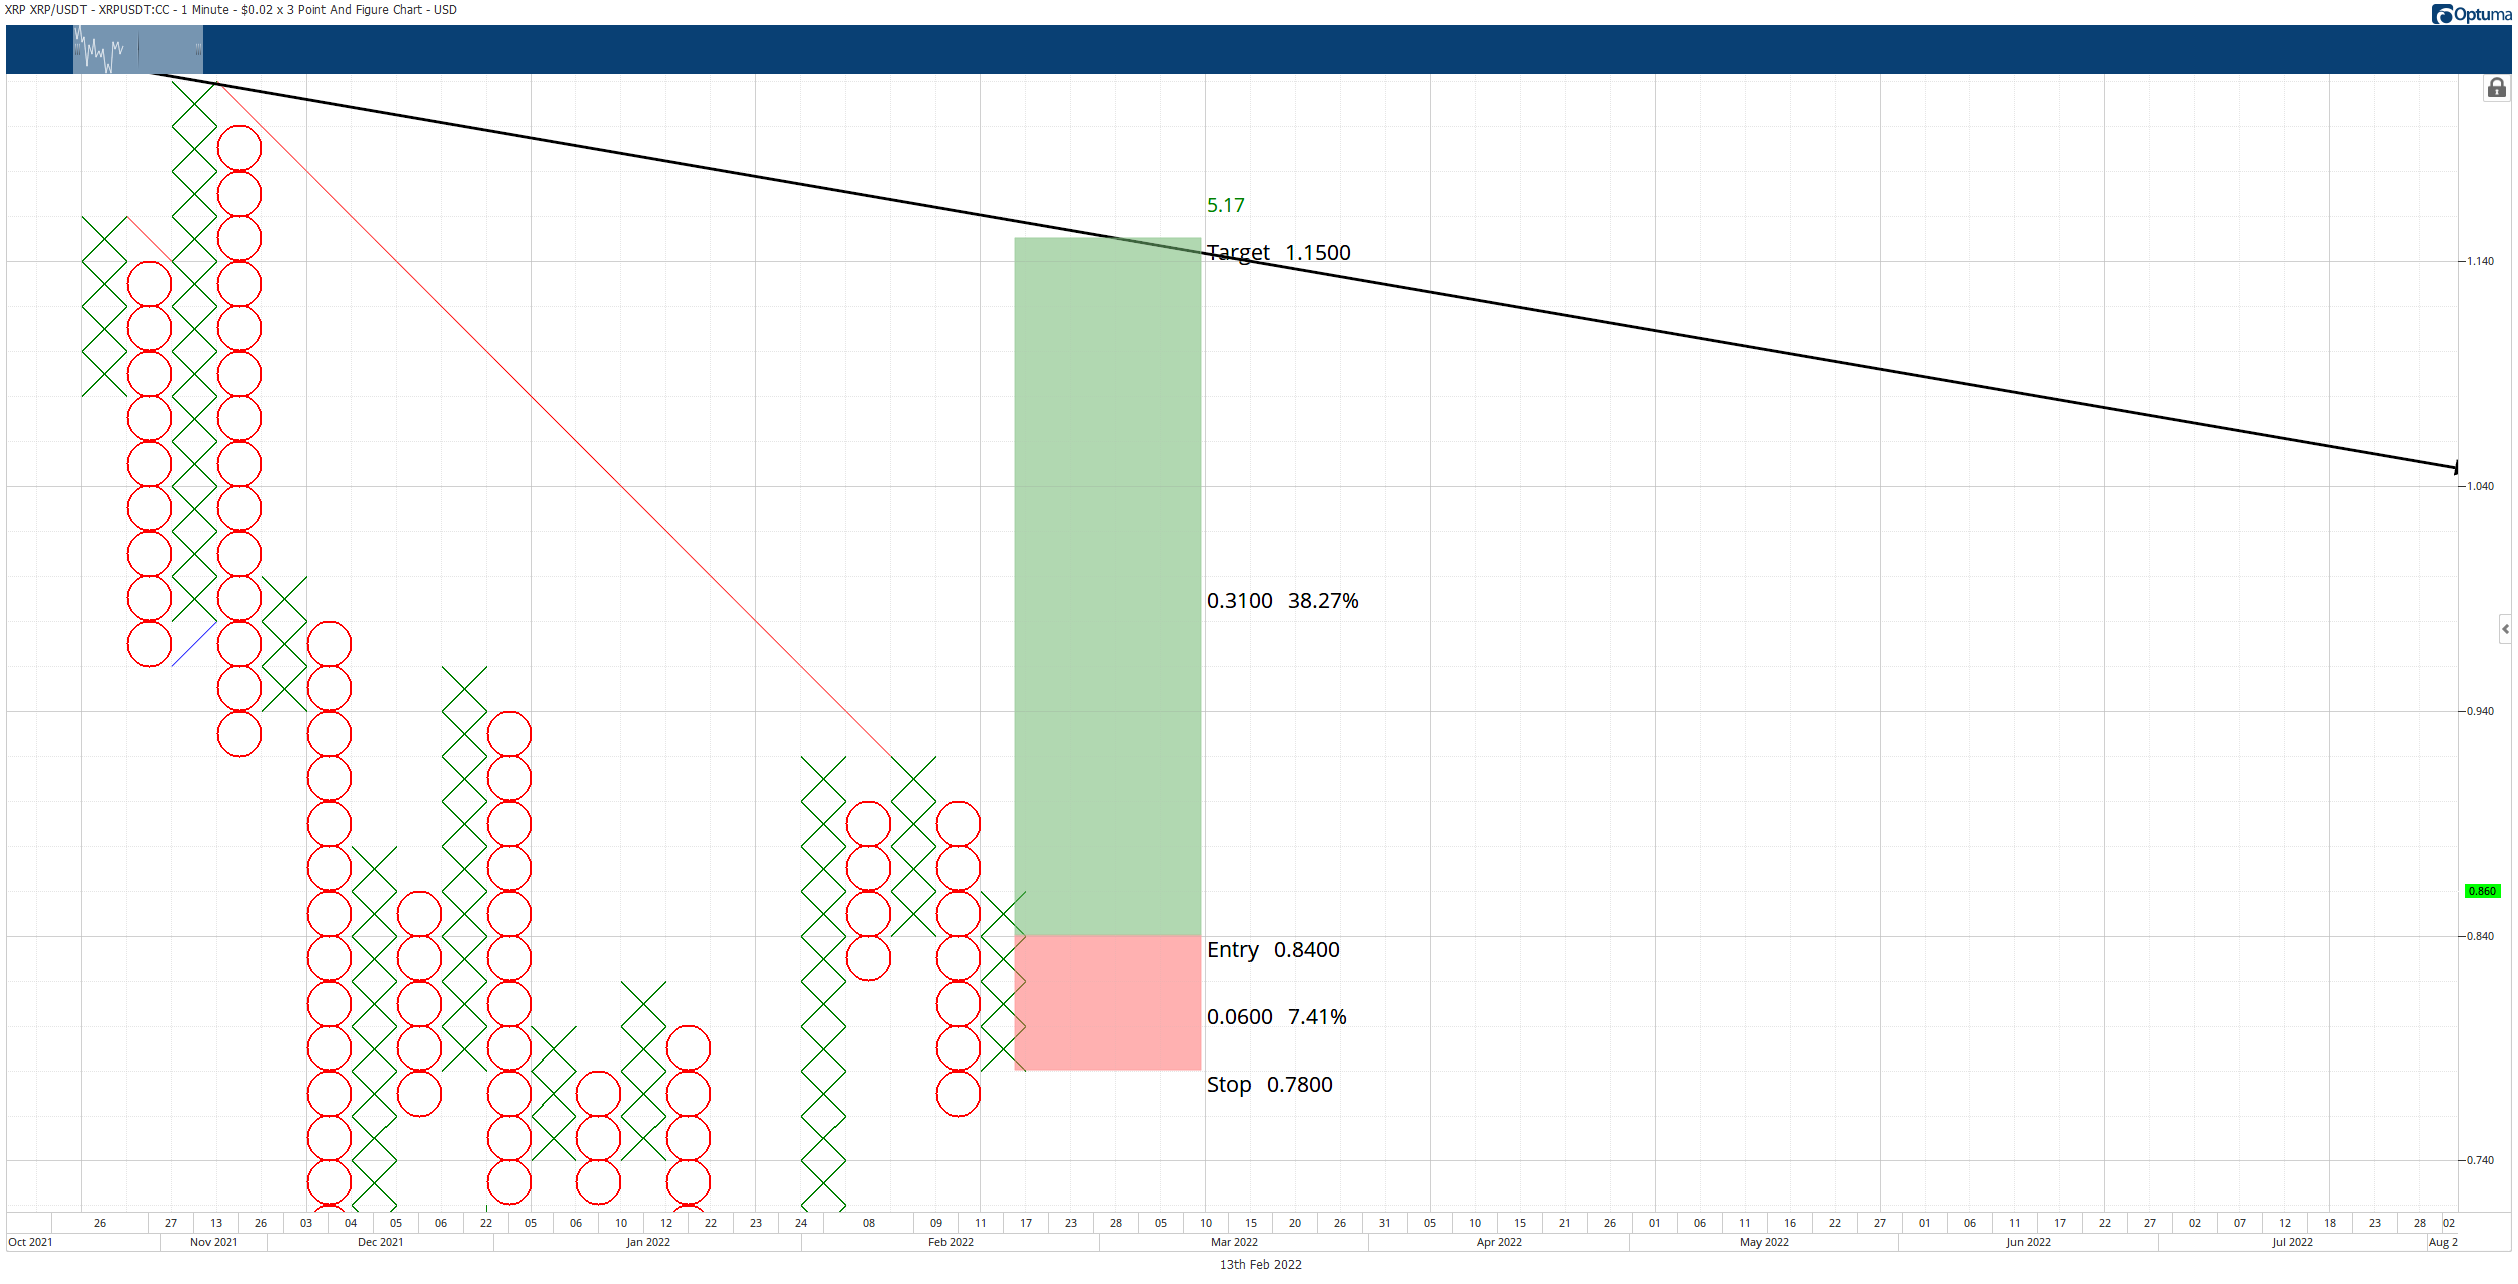
XRP/USDT $0.02/3-box Reversal Point and Figure Chart
The long trade idea for XRP price is a 12.33:1 reward/risk if the target is at $1.58 and 5.17:1 if the target is at $1.15.
Invalidation of this long opportunity would only occur if the current O-column returned to bear market conditions – which would occur if it moved to $0.62.
Author

Jonathan Morgan
Independent Analyst
Jonathan has been working as an Independent future, forex, and cryptocurrency trader and analyst for 8 years. He also has been writing for the past 5 years.




