Ethereum may slide to $2,700 before ETH begins a new uptrend
- Ethereum price is below two critical support levels, likely moving to its final Ichimoku support.
- Oscillator conditions continue to favor a swing low developing, continuing the current upswing.
- $2,700 price range is now in focus as the final daily support level.

Ethereum price action has fallen below the Tenkan-Sen at $3,000 and the 50% Fibonacci retracement at $2,900. Participation and momentum have dropped significantly on both sides of the market, but the overall near-term trend is lower.
Ethereum price action continues its slow slide south toward its final support zone at $2,700
Ethereum price closed below the 50% Fibonacci retracement at $2,900 on Sunday, but follow-through selling pressure has been almost nil despite a slow drip lower. A slow bleeding and continued move south is expected until bulls spontaneously re-enter to support ETH or until Ethereum hits the Kijun-Sen at $2,700.
The inverse head-and-shoulders pattern identified on February 12, along with the bullish divergence in Ethereum’s oscillators, all remain in play and structurally unchanged. Ethereum price could dip to the 61.8% Fibonacci retracement at $2,500 before finding a swing low, but it would threaten to cancel the hidden bullish divergence present between the candlestick chart and both, the Composite Index and Optex Bands.
The hidden bullish divergence became more extended, enhancing the strength and likelihood of a swing low developing very soon. However, if bulls establish a new swing low in the $2,500 to $2,700 price range, they still need to contend with a massive cluster of resistance in the $3,150 to $3,300 value area. The 2022 Volume Point Of Control, top of the Ichimoku Cloud (Senkou Span B), 38.2% Fibonacci retracement, and lower trendline of a prior bear flag exist within that $3,150 to $3,300 price range.
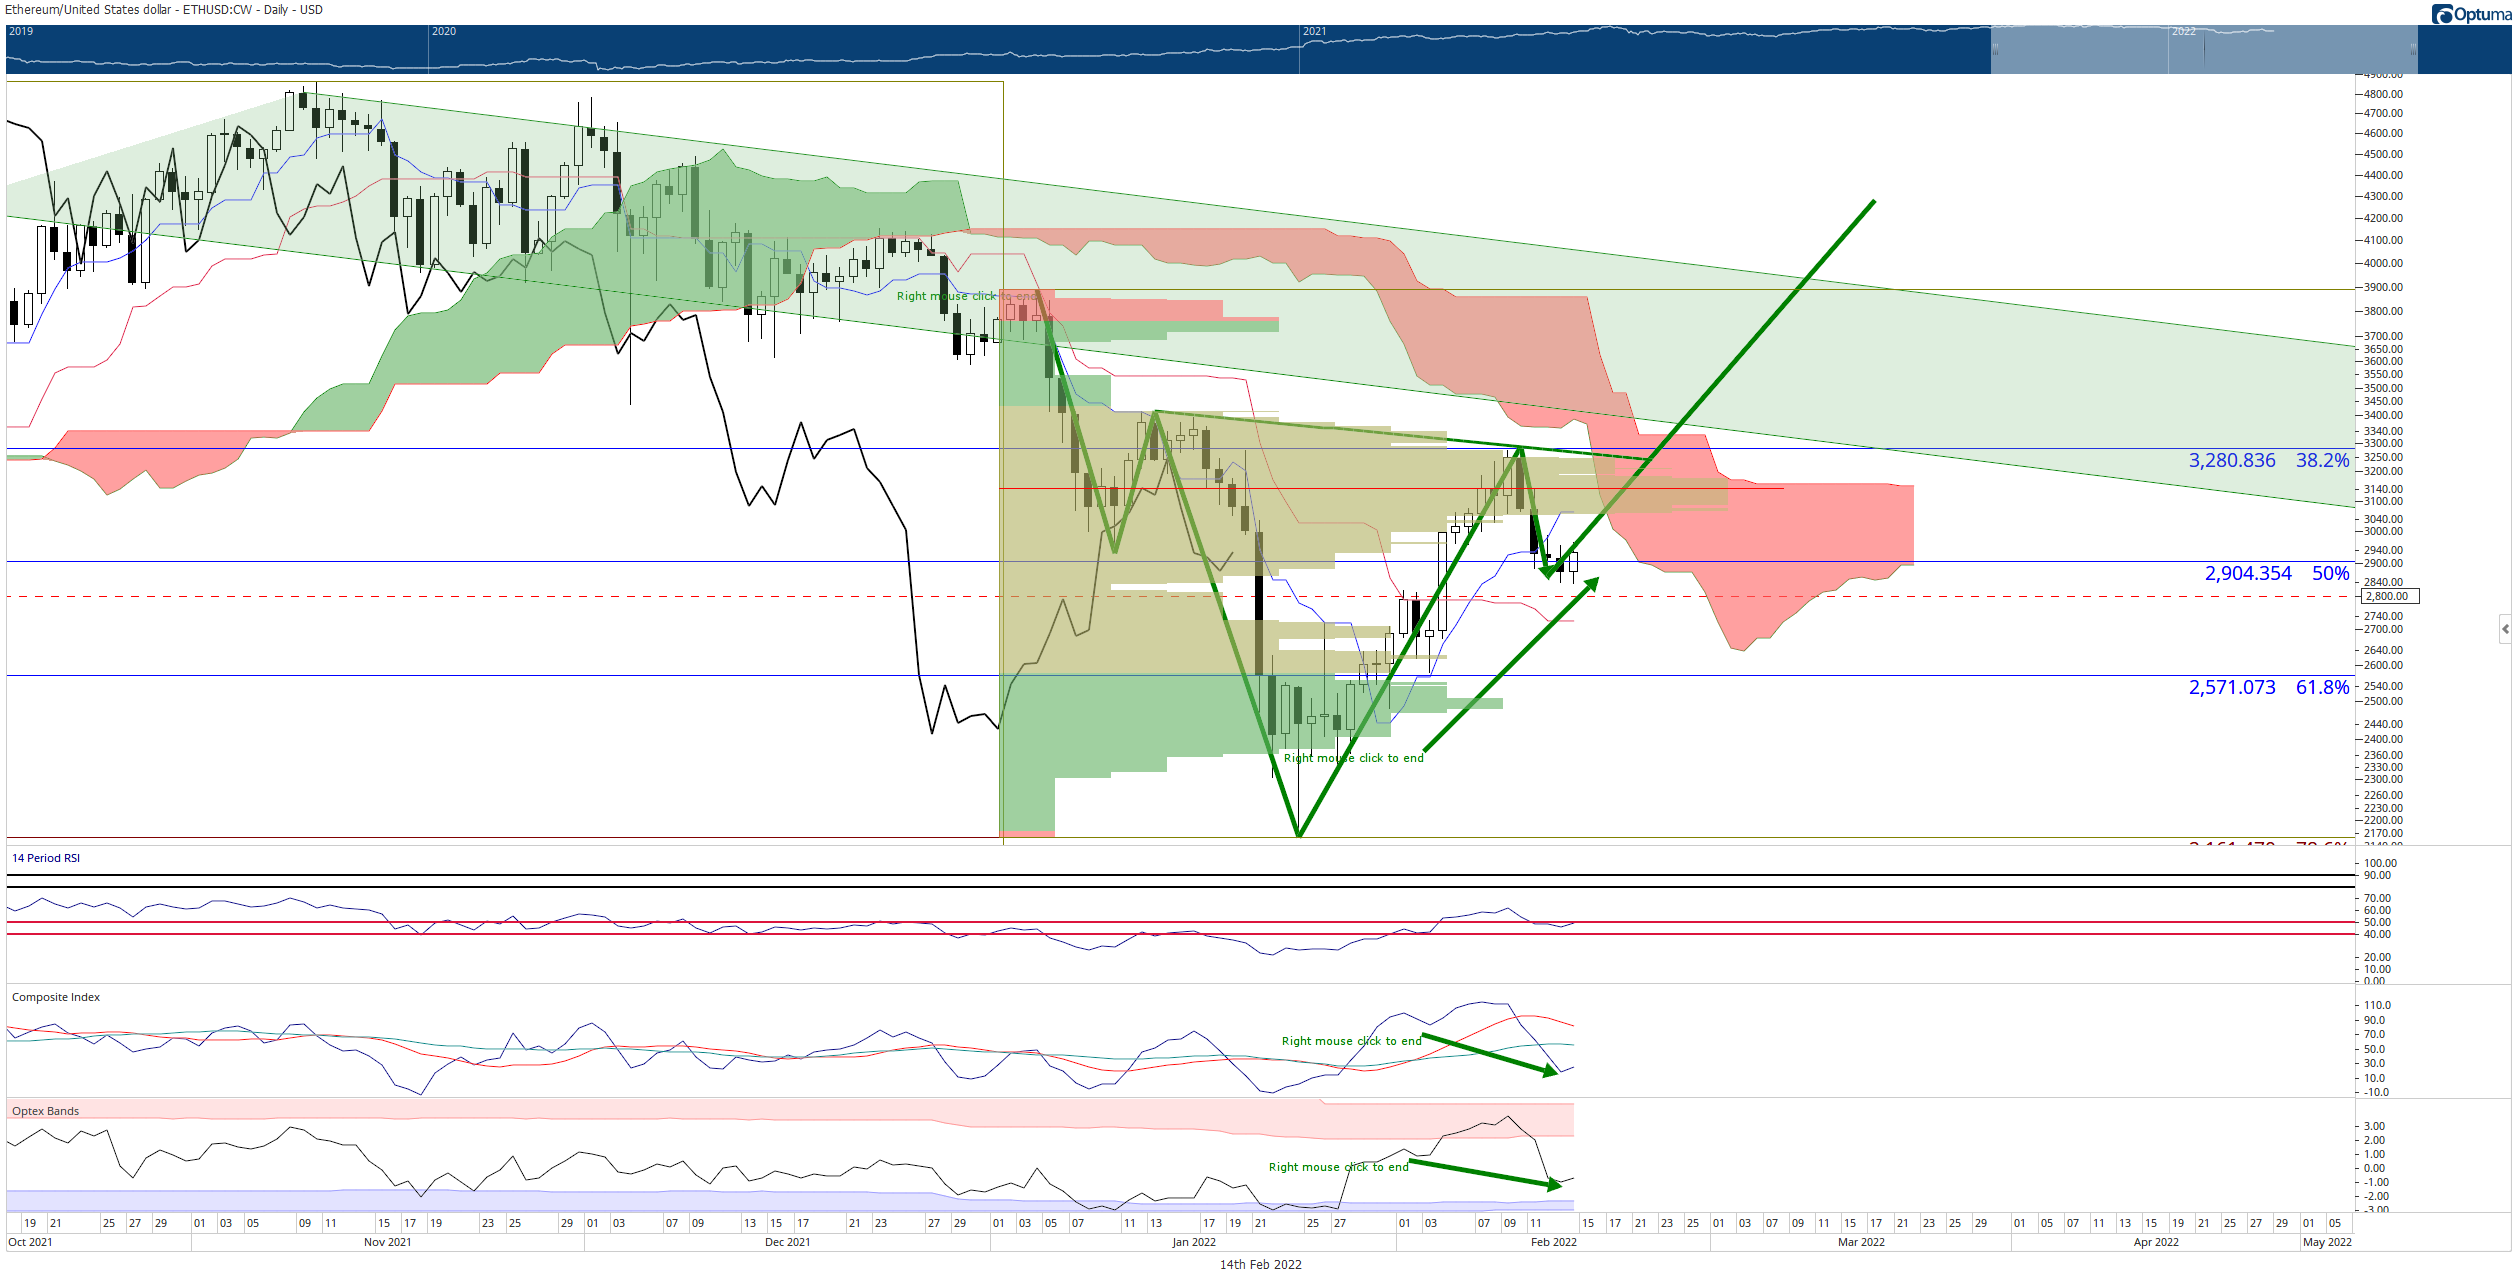
ETH/USD Daily Ichimoku Kinko Hyo Chart
A successful breakout for Ethereum price above $3,300 would quickly generate a move to retest $4,000.
Bulls and bears will want to watch for any daily close below the 61.8% Fibonacci retracement at 2,500 as it would signal a highly probable sell-off to retest the 2022 low near $2,100.
Author

Jonathan Morgan
Independent Analyst
Jonathan has been working as an Independent future, forex, and cryptocurrency trader and analyst for 8 years. He also has been writing for the past 5 years.


