Top 3 Price Prediction Bitcoin, Ethereum, Ripple: BTC and XRP correct in time versus price as ETH remains unstoppable
- Bitcoin price logs ten consecutive up days, yielding a 41.76% return and closing last week up 12.52%.
- Ethereum price closed last week up 16.53% and finished July with a gain of 11.29% after being down 24% at the July 20 low.
- XRP price stalls at formidable resistance after triggering a double bottom pattern.

Bitcoin price ends three-month decline with a compelling 18.35% gain in July while Ethereum price is working on a historic 13 consecutive up days. XRP price closed last week with the best weekly return since the end of April.
Bitcoin price realizes the weight of the quadfecta of resistance
Over ten days, from July 21 to July 30, Bitcoin price rallied 41.76%, marking the best ten-day period since the February gain of 43.14% and the January gain of 48.60%. However, it is the most profitable rebound off a major low since the February 2018 gain of 46.80%. Similar BTC gains occurred during established advances and often marked a local top or the final high.
There is no doubt that Bitcoin price has formed an impulsive rebound that notably deviates from other major lows due to the magnitude of the gain and sustainability. It is essential to note the comparative from 2018 was just an oversold bounce after the first leg lower from the 2017 high. BTC did go on to a major decline before finally bottoming in December 2018. Thus, investors should be mindful of that precedent as the flagship cryptocurrency confronts heavy resistance.
The magnitude and sustainability of this rally pushed Bitcoin price to a quadfecta of resistance that is now influencing BTC and may continue for several days or weeks. The first resistance point is the Ichimoku Cloud that was surpassed on July 30 after two days of struggle. Beyond the Ichimoku Cloud is the June 15 high of $41,322, the 38.2% Fibonacci retracement of the April-June correction at $42,589 and the February 28 low of $43,016. Combined, those final three levels are now being engaged by Bitcoin price with negative results.
As was mentioned late last week, the optimal scenario for Bitcoin price is a correction in time, meaning BTC moves sideways with a mild downward drift, releasing the overbought condition that is now evident on the daily Relative Strength Index (RSI) but sustaining the current gains and momentum. It would be a clear sign of a robust underlying bid and the presence of long-term directed investors.
If the current pause evolves into a meaningful pullback, the valid BTC support begins with the confluence of the June 29 high of $36,675 with the Ichimoku Cloud. Suppose the Bitcoin price level fails to restrict the selling pressure. In that case, the now-rising 50-day simple moving average (SMA) at $34,957 should successfully defend against any further weakness, presenting a 12% loss from the current price and a fall of 18% from the August 1 high of $42,605.
Any weakness below the tactically important 50-day SMA would require reassessing the bullish narrative outlined by the Bitcoin price action since the July 20 low.
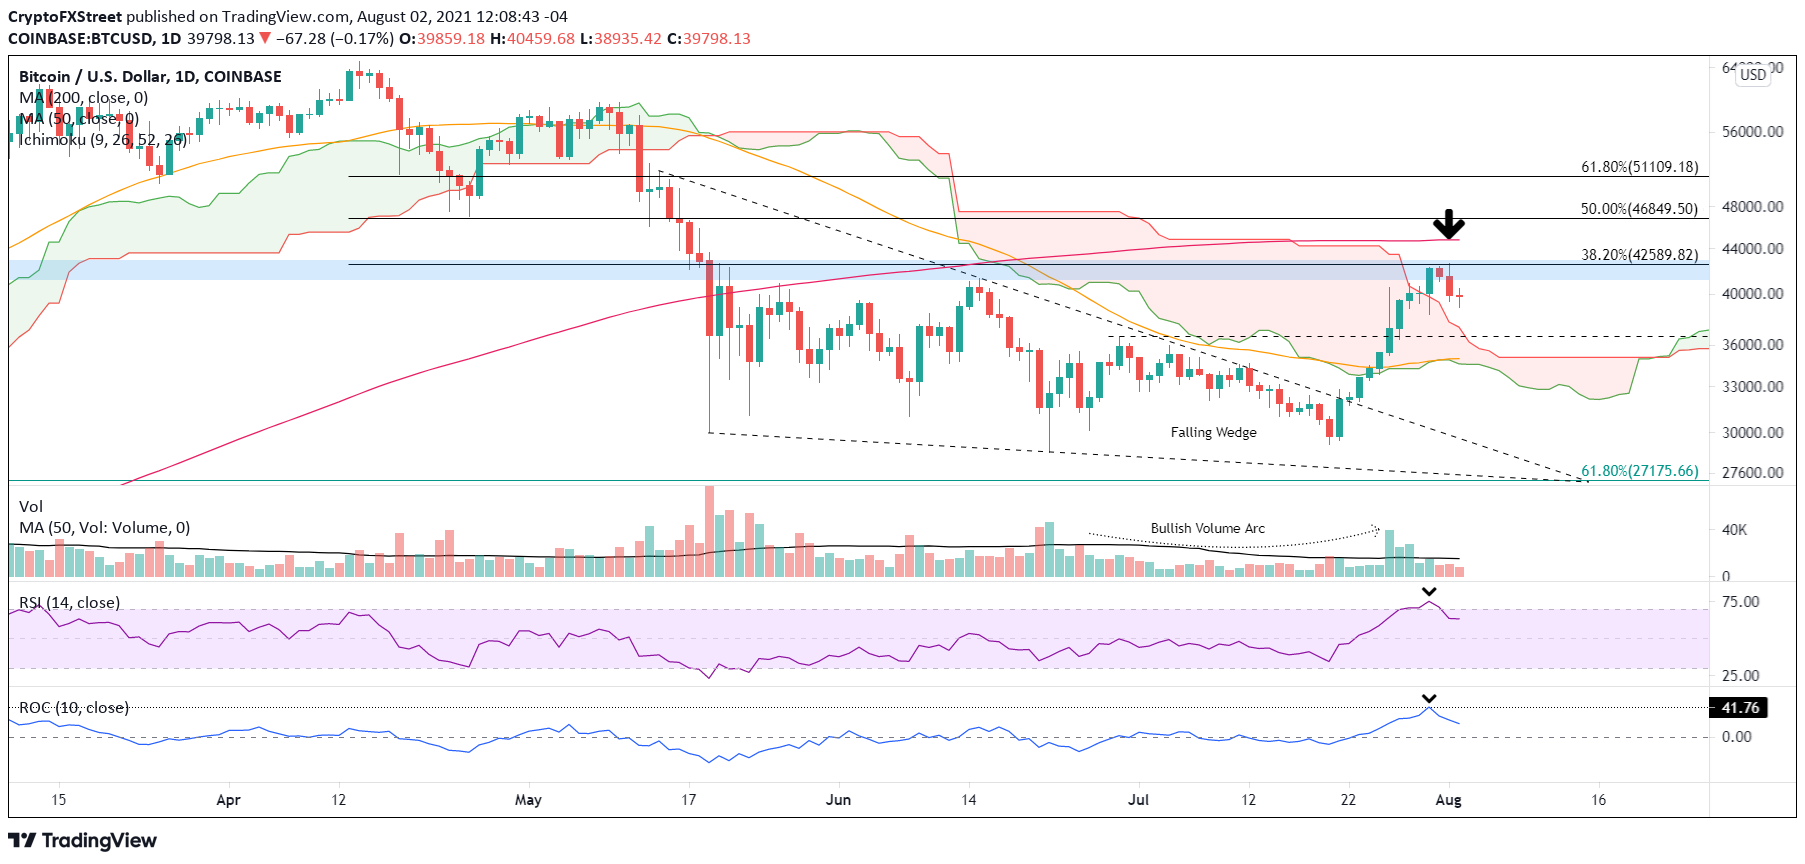
BTC/USD daily chart
A renewal of buying pressure will find some resistance at the strategically important 200-day SMA at $44,743, followed by the 50% retracement at $46,849 and then the 61.8% retracement at 51,109.
Bitcoin price is confronting a major technical challenge, suggesting that BTC investors should be prepared for a period of consolidation and reflection. Nevertheless, the impulsiveness of the move off the lows has positioned the cryptocurrency for bullish outcomes moving forward. It is now about patience and commitment as Bitcoin transitions from a rally to an advance.
Here, FXStreet's analysts evaluate where BTC could be heading next as it seems bound for a rebound before capitulation.
Ethereum price anticipates the London hard fork with historic rally
Ethereum price is now on pace for 13 consecutive up days, marking a historic milestone for ETH and a gain of over 48% during the period. Like BTC, the 48% gain is not the largest for 13 days, but it is near the best coming off the low, confirming the rally’s impulsiveness and sustainability. Moreover, it lifted the smart contracts giant from a loss of 24% in July to a gain of 11.29% by the month’s end and elevated the daily RSI to an overbought condition for the first time since the beginning of May.
The ETH rally from July 21 overcame most resistance levels with incredible ease, including the upper trend line of the descending triangle pattern that had enforced Ethereum price action since the March collapse. ETH is now encountering resistance at the Ichimoku Cloud. A breakthrough at the Cloud places the cryptocurrency on the trajectory to test the $2,900-$3,000 range where May and June rebound highs coincide. A test of the range would result in a 74% gain from the July 20 low.
It is important to mention that an FXStreet article on July 20 argued the potential for Ethereum price to rally.
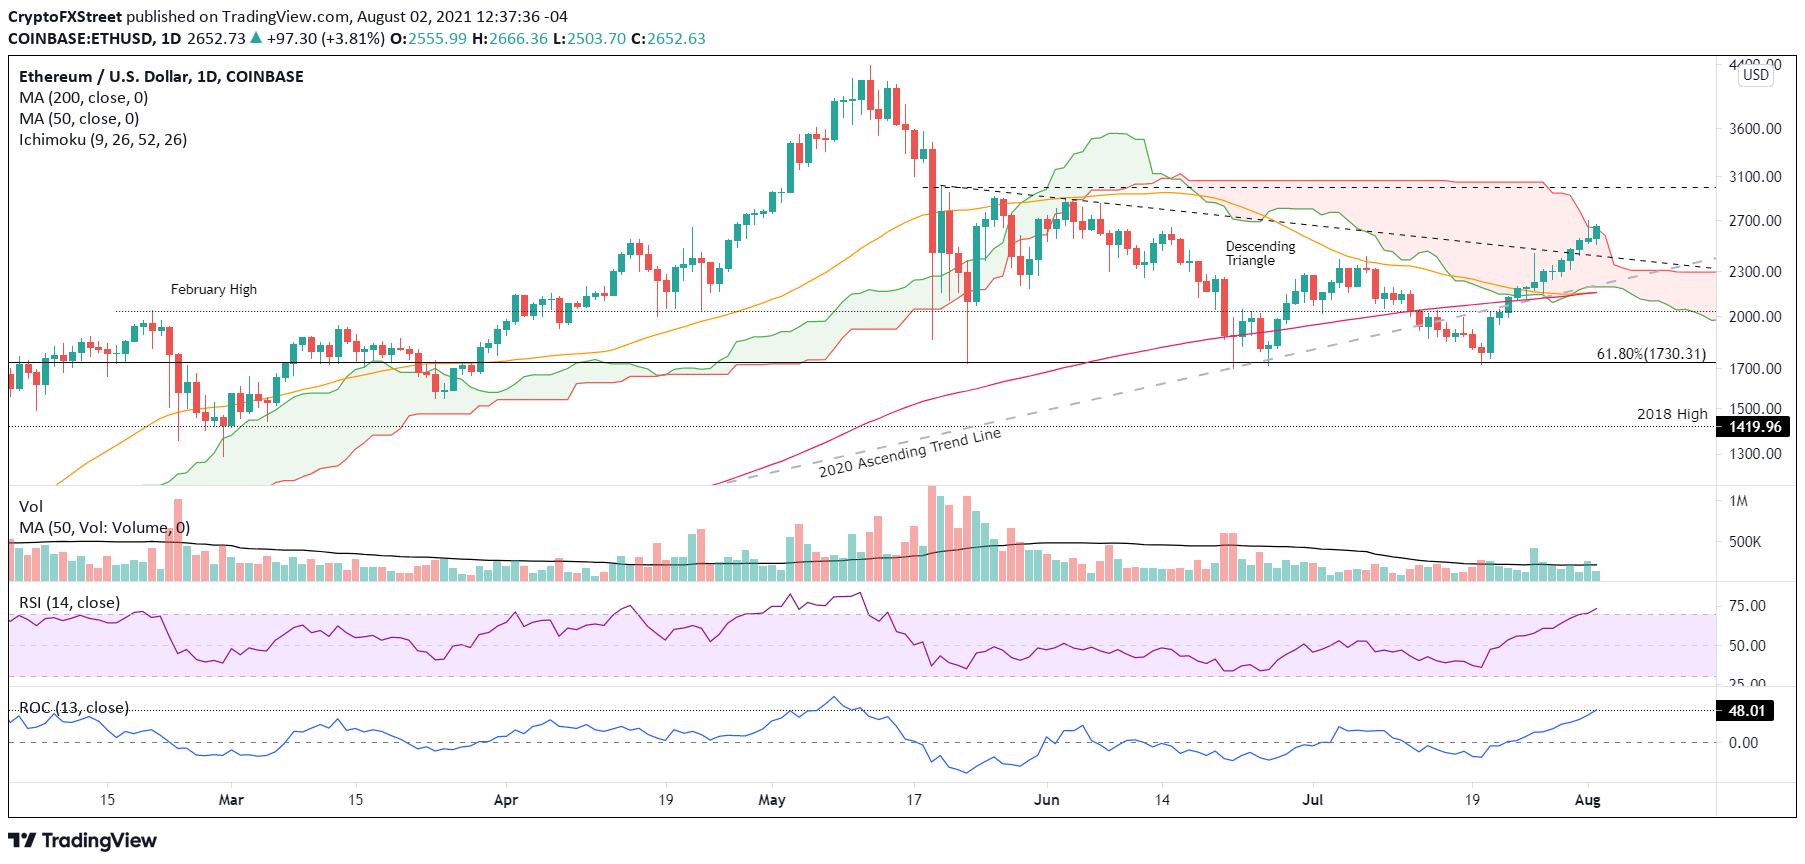
ETH/USD daily chart
On the downside, Ethereum will discover support at the upper trend line of the descending triangle at $2,418, but an ETH correction should not exceed the 2020 ascending trend line, currently at $2,209.
The much anticipated London hard fork has put Ethereum price in a position to succeed moving forward, with the most challenging resistance levels now acting as support.
Here, FXStreet's analysts evaluate where ETH could be heading next as it looks primed for higher highs.
XRP price now at a crossroads as two levels press down on the rally
Over the last 13 days, XRP price has climbed 42.33%, representing the best gain since the bounce from April low; in the process, Ripple triggered a double bottom pattern with a daily close above $0.733 on July 29. Additionally, it reached the impressive resistance outlined by the 200-day SMA at $0.779 and the neckline of a multi-year inverse head-and-shoulders pattern around $0.722.
Over the last five days, XRP price has been trading sideways, showing a correction in time versus price. A constructive development for Ripple, which demonstrates a solid commitment to the cryptocurrency.
The measured move of the Ripple double bottom is close to 30%, targeting an XRP price of $0.953 based on the double bottom trigger of $0.733. The target falls short of the critical resistance framed by $1.00 and the 38.2% retracement level of the April-June correction at $1.06.
A daily close above the 200-day SMA at $0.779 should signal a continuation of the Ripple rally to at least the measured move target and possibly beyond if the cryptocurrency complex maintains the strong bid.
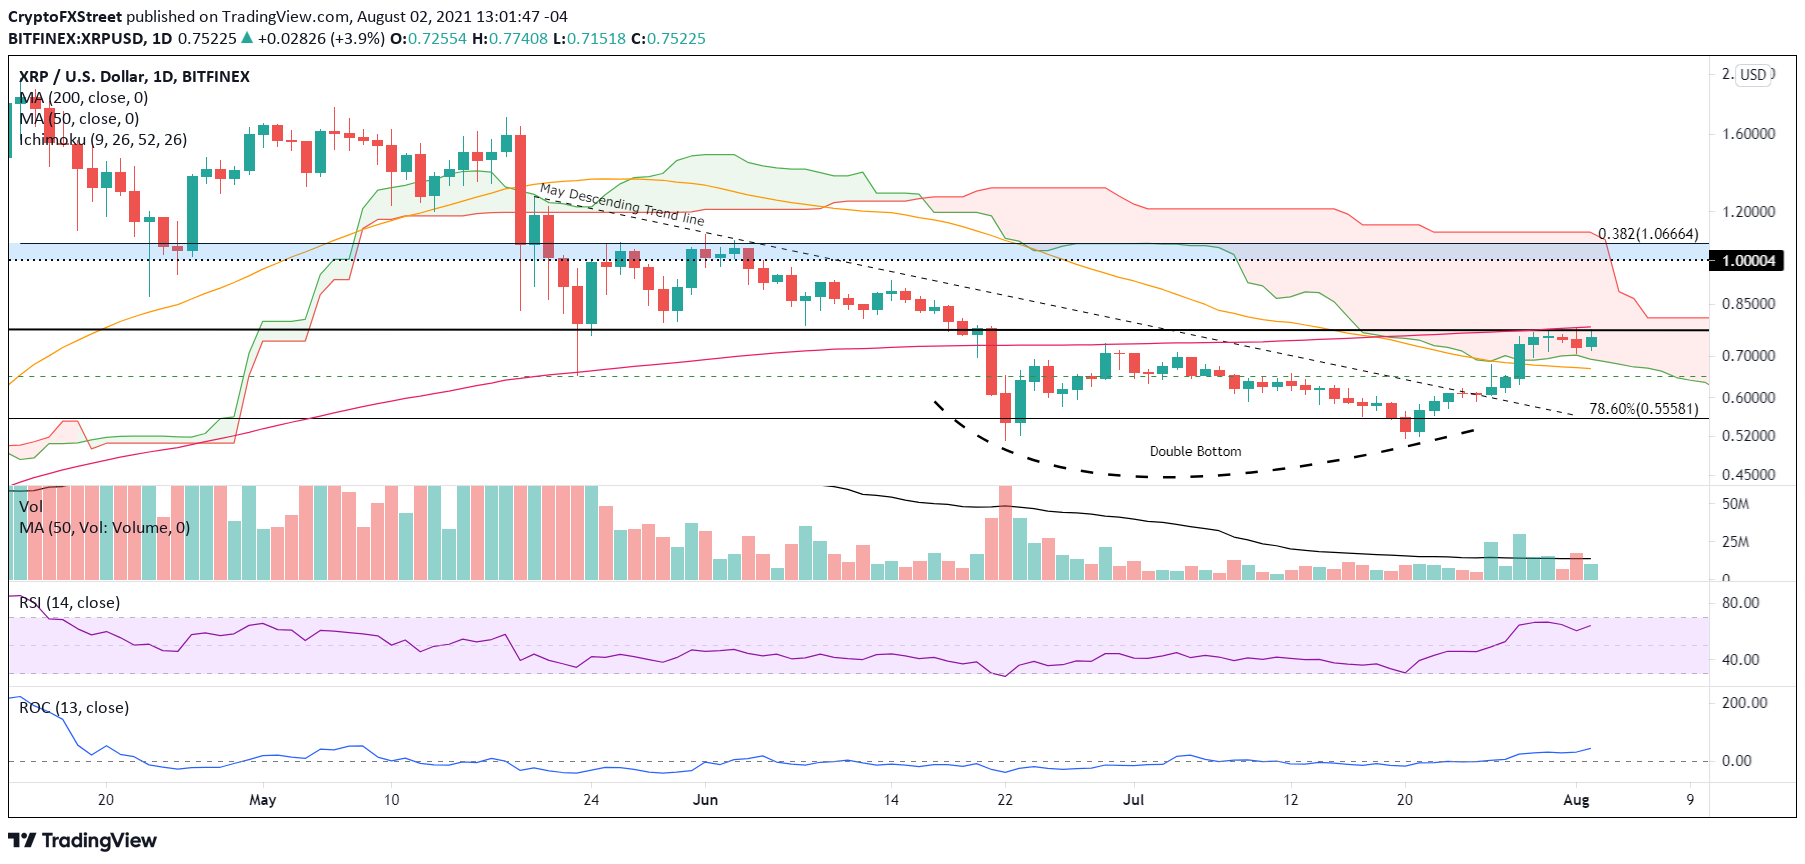
XRP/USD daily chart
The XRP price should hold the 50-day SMA at $0.667 during the developing consolidation to maintain the Ripple rally. At worst, the May 23 low of $0.652. A correction in time should hold the support afforded by the Ichimoku Cloud around $0.690.
The three crypto majors have shown the impulsiveness off the July lows that is consistent with a new advance and better outcomes for the long term. However, Bitcoin price and XRP price have struck imposing resistance levels and are consolidating. The best scenario is for the cryptocurrencies to correct in time versus price, thereby maintaining the basis for the impressive momentum that has been present over the last two weeks. And continues with Ethereum price as of today.
Here, FXStreet's analysts evaluate where Ripple could be heading next as it advances further.
Author

Sheldon McIntyre, CMT
Independent Analyst
Sheldon has 24 years of investment experience holding various positions in companies based in the United States and Chile. His core competencies include BRIC and G-10 equity markets, swing and position trading and technical analysis.


