Top 3 Price Prediction Bitcoin, Ethereum and XRP: Bitcoin leads the market into uncertainty
- Bitcoin is holding above $10,800 while approaching $11,000 at a snail's pace.
- Ethereum opens the way for gains to $370 after overcoming the hurdle at $370.
- Ripple is on the verge of a breakout to $0.25 despite consolidation, as observed by on-chain metrics.

The sluggish trading across the market seems far from over. The majority of cryptocurrencies are facing uncertainty, especially with consolidation taking precedence. However, some selected digital assets are decoupling from Bitcoin and other major cryptocurrencies. They include Monero (XMR), up 12.5% in the last 24 hours, Zcash (Zec), up 11.5%, Algorand (ALGO), up 10%, and DigiByte (DGB), up 12%. The indecisiveness across the market is reflected by the minor change in the total market capitalization from $345 billion on September 30 to $346 billion on October 1.
Bitcoin still focused on breaking above $11,000
Bitcoin is trading at $10,840 after first, bouncing off support explored on Wednesday at $10,700 and breaking above a short term descending triangle. An attempt to continue the uptrend to $12,000 was abandoned under $10,900. In the meantime, bulls seem to be nurturing an uptrend to pull the price above the coveted $11,000 level. The Relative Strength Index in the hourly range has settled above the midline while pointing upwards, which is a signal for a growing bullish grip.
BTC/USD 1-hour chart
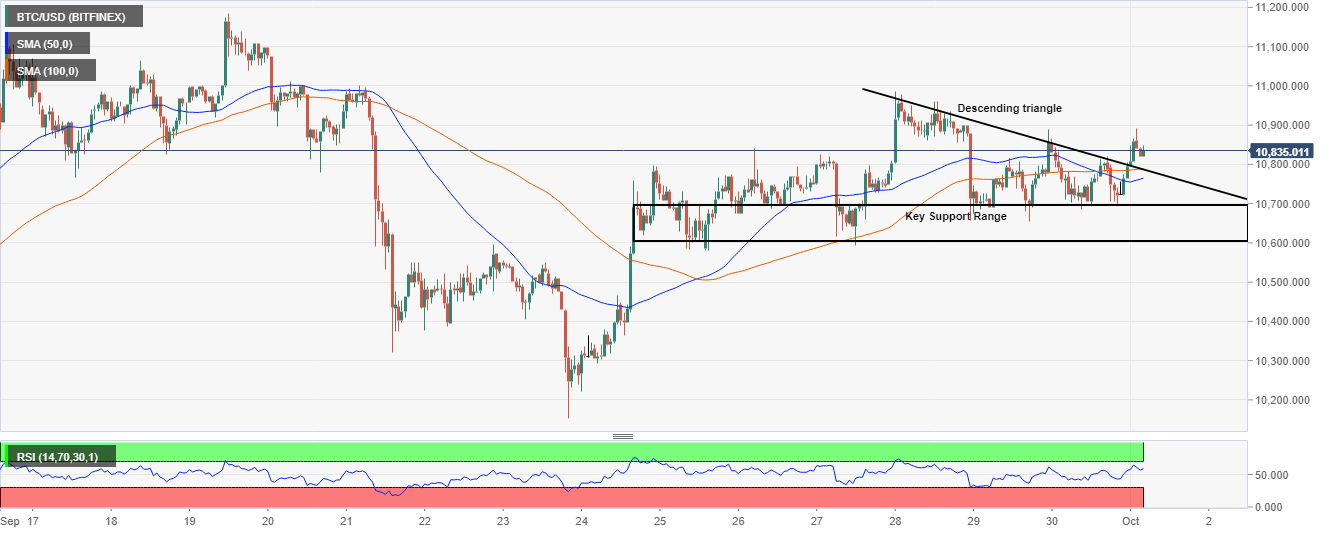
Note that a close above the 50 Simple Moving Average (SMA) would keep the bullish outlook intact. However, the critical support range between $10,600 and $10,700 is in line to absorb most of the selling pressure if Bitcoin starts to retreat from the current price level.
IntoTheBlock's IOMAP model reveals that the path of least resistance remains to the upside. The most significant resistance lies at $11,500 - $11,800. Here, 971,000 addresses previously bought 750,000 BTC. A break above $11,000 will hit pause in this zone before resuming the uptrend to $12,000.
Bitcoin IOMAP chart
-637371308456253954.png)
On the flip side, the flagship cryptocurrency is resting on an area of immense support, highlighted by IntoTheBlock between $10,500 and $10,800. Previously, 1.87 million addresses bought 1.5 million BTC. The support looks strong enough to absorb the selling pressure if Bitcoin starts to retreat.
Ethereum kick starts the journey to $370
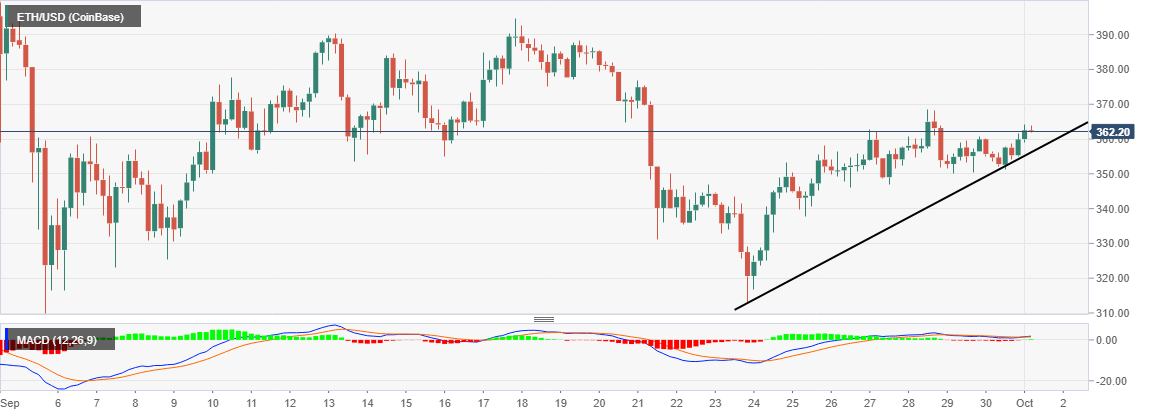
Ethereum finally made it above the stubborn seller congestion at $360. The smart contracts giant is trading at $362. Unfortunately, the rapid growth expected after conquering the hurdle never materialized. For now, sideways trading with a bias to the north is dominating the market. If $360 becomes formidable support, Ether could quickly push to highs above $370. Meanwhile, the Moving Average Convergence Divergence (MACD) is holding above the midline but horizontally, further emphasizing the consolidation.
ETH/USD 4-hour chart
According to IntoTheBlock's IOMAP model, Ethereum has a relatively smooth path to $400. However, we must take note of the seller congestion at $373 - $384. Here, approximately 1 million addresses bought 7.5 million Ether. On the downside, the smart contract token is holding above the levels with immense support. The most robust support stands between $340 and $350. Previously, 513,000 addresses bought 9.2 million ETH in this range. It is doubtful that Ethereum will drop below this zone in the near term.
Ethereum IOMAP
-637371309336363841.png)
XRP holding onto the bullish outlook
XRP bulls have refused to abandon the delay in the rally to highs above $0.25. They are prepared to fight to the end despite the bearish camp appearing to win the tug of war. XRP is teetering at $0.2420 while dealing with the seller congestion at the 100 SMA in the 4-hour range. A break and above this zone is likely to kick start the leg up to $0.25.
On the downside, XRP is in place due to the buyer congestion at the 50 SMA. The RSI in the same range is leveling at 50, bringing to light the possibility of consolidation taking over. It is essential to wait for a confirmed breakout towards $0.25 before going all-in on XRP.
XRP/USD 1-hour chart
 (70)-637371309978746290.png)
The exchange inflow metric by Santiment, a leading provider of on-chain data, shows that the inflow of XRP into exchanges surged on September 30. The influx is still at its peak on October 1, suggesting that XRP is on the verge of a breakout that could take down the resistance at $0.25. The chart illustrates that a spike usually follows high inflow into exchanges in the price.
XRP exchange inflow chart
 [09.17.20, 01 Oct, 2020]-637371310267059779.png)
The bellwether cryptocurrency is quite indecisive at the moment. On-chain metrics show that the path to $11,000 is relatively clear. On the downside, BTC's support is immense, hence the unlikelihood of the price dropping to $10,000.
On the other hand, Ethereum has corrected above the resistance at $360, shifting the bulls' focus to $370. On the flip side, Ether is holding above the areas of enormous support.
Lastly, the fourth-largest cryptocurrency is holding above the 50 SMA and $0.24. The high exchange inflow is likely to force an uptrend in the price, perhaps strong enough to push XRP above $0.25.
Author

John Isige
FXStreet
John Isige is a seasoned cryptocurrency journalist and markets analyst committed to delivering high-quality, actionable insights tailored to traders, investors, and crypto enthusiasts. He enjoys deep dives into emerging Web3 tren


