Bitcoin Price Forecast: BTC remains sluggish, yet solid – Confluence Detector
- BTC has managed to stay above $10,000 for 65 days.
- Bitcoin’s daily confluence detector shows an immediate moderate resistance level at $10,850.

The premier cryptocurrency remains limbo as it trends between $10,825 and the SMA 20 curve. While the MACD shows sustained bullish momentum, it seems unlikely that the buyers will be able to push the price above the $11,075 resistance line and the SMA 50 curve.
BTC/USD daily chart
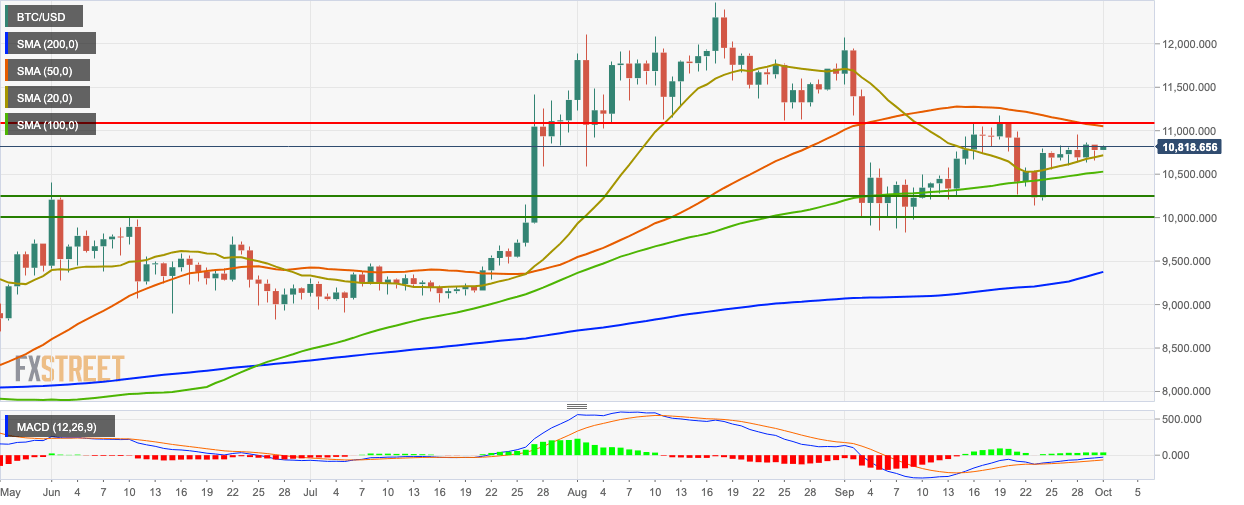
Another interesting thing to note in the daily chart is that the price has remained above $10,000-level since July 28, 2020. That’s 65 days and counting, making this the longest stretch that BTC has been trending above the $10,000. While the price may have briefly dipped under $10,000 in this period, it never started or ended a day below $10,000.
Before this, the longest stretch above $10,000 happened at the end of 2017 and lasted for 62 days. Analyst Jason Deane attributes this new record to the “MicroStrategy effect.”
Price had just passed the $10,000 mark when their first acquisition announcement came on August 11, and the impact of this bold, ground-breaking move by Michael Saylor [Microstrategy CEO] was to drive substantial confidence and credibility into the asset.
Plus, Bitcoin’s price volatility has been relatively stable during this period. In one of the coin’s previous runs, the price fluctuated by 53%. In this run, however, it only moved 20%, signifying stability.
BTC/USD 4-hour chart
-637371180724202936.png)
The bulls found support at the $10,715 support line and jumped up to $10,830, over two sessions. In the process, the price ripped through the SMA 20, SMA 100 and SMA 200 curves. The MACD shows that the market momentum is on the verge of reversing from bearish to bullish, following the positive price action.
After failing to get past the $10,900 resistance level, the 4-hour price has charted lower highs. The bulls will ideally want to reverse this trend by breaking above the $10,845 resistance line.
Bitcoin on-chain metrics
Now, that we have seen the BTC price action, let’s see how the overall network is fairing. A healthy network usually leads to healthy price action.
#1 New addresses entering
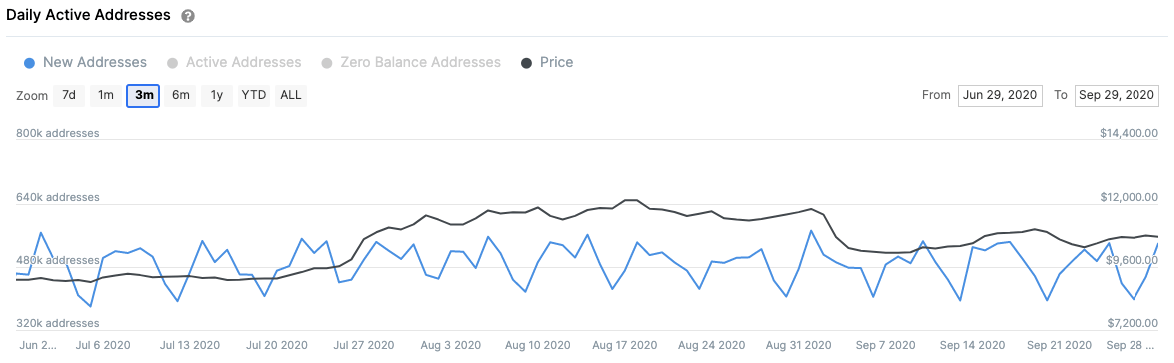
IntoTheBlock’s “Daily Active Addresses” model shows that the number of new addresses created on the Bitcoin network topped-out on September 1 at a high of 572,250 addresses per day is calculated 3-month trailing average. Since then, Bitcoin’s network growth has remained consistent. At press time, 539.450 new addresses were created, up from this Wednesday’s 455,600. This can be considered a bullish sign for BTC.
#2 BTC velocity
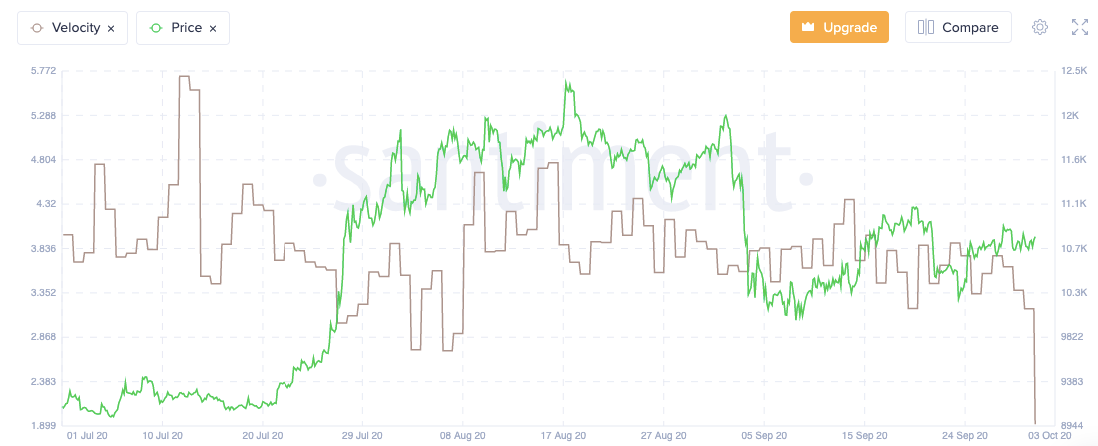
Velocity is another great metric that can help us judge Bitcoin’s network sentiment. As per Santiment, velocity shows the average number of times that a single BTC token changes addresses daily. Higher token velocity means that a single token is used more often in daily transactions. On the other hand, a low velocity means that the holder treats the token as a store-of-value and they would rather hold on to it instead of giving it away.
Velocity has an inverse relationship with the price. Lower the velocity, the higher the price. Since September 27, the velocity has dropped from 3.76 to 3.18, which is a good sign.
BTC daily confluence detector
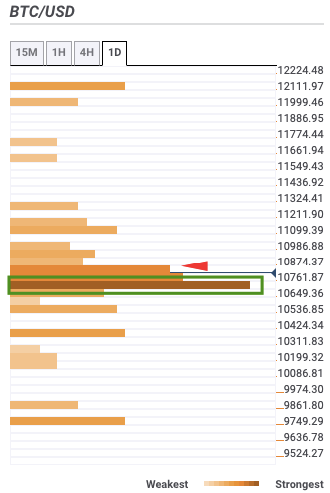
The daily confluence detector is a handy tool that can help us predict future price movements. The price is presently sitting on top of a healthy support stack, $10,700-$10,800. On the upside, BTC faces an immediate moderate resistance level at $10,850.
If the buyers manage to break past the $10,850 level, the confluence detector lacks strong and moderate resistance levels to $12,000. However, as noted earlier, its unlikely that the bulls will have enough momentum to take the price up to those levels.
Author

Rajarshi Mitra
Independent Analyst
Rajarshi entered the blockchain space in 2016. He is a blockchain researcher who has worked for Blockgeeks and has done research work for several ICOs. He gets regularly invited to give talks on the blockchain technology and cryptocurrencies.


