Top 3 Price Prediction Bitcoin, Ethereum and XRP: Bitcoin slumps to $10,700 as bears return
- Bitcoin bulls exhausted as a retreat to $10,600 beckons.
- Ethereum enters a period of consolidation after hitting a barrier at $360.
- XRP is holding above the short term support at $0.24 after rejection at $0.25.

Cryptocurrencies are in red on Wednesday as we usher in the European session. Major digital assets such as Bitcoin, Ethereum, and XRP have been capped under key resistance levels at $11,000, $360, and $0.25 in that order. On the contrary, some selected cryptocurrencies like Cosmos (ATOM) and THETA are up 12% and 9%, respectively. On the other extreme end, UMA is among the worst-hit digital assets, after plunging more than 10% over the last 24 hours.
Bitcoin price breakdown to $10,600 in the offing
Bitcoin is retreating into another short term downtrend after failing to sustain gains above $10,800. Intriguingly, buyers seem exhausted even though Bitcoin hit levels slightly above the 50 SMA in the 1-hour range.
At the time of writing, Bitcoin is teetering at $10,730 after sliding under the Bollinger Bands middle layer. If support at $10,700 gives in to the selling pressure, we can expect Bitcoin to extend the breakdown to $10,600 (support that has been very key over the last seven days.
It is essential to observe the Relative Strength Index (RSI) as it slipped beneath the midline. The RSI measures the strength of a particular trend and whether an asset has been oversold or overbought. The oversold and overbought conditions often call for a reversal. If the RSI moves to the oversold, it will trigger as selloff eyeing $10,600.
BTC/USD 1-hour chart
 (38)-637370449405588815.png)
On the flip side, a recovery above the Bollinger Band middle layer could pave the way for another shot at $11,000. However, it is essential to note that the seller congestion at the 100 Simple Moving Average and 50 SMA may absorb some buying pressure, thereby slowing the uptrend.
IntoTheBlock’s IOMAP model reveals strong support for Bitcoin between $10,400 and $10,700. Previously, 1.2 million addresses bought 1.08 million BTC. Losses are unlikely to extend below this zone because there is enough buyer power to absorb the selling pressure. The most significant resistance lies between 11,400 and $11,700. Here, 1.1 million addresses previously purchased 686,000 BTC.
Bitcoin IOMAP chart
-637370450098758323.png)
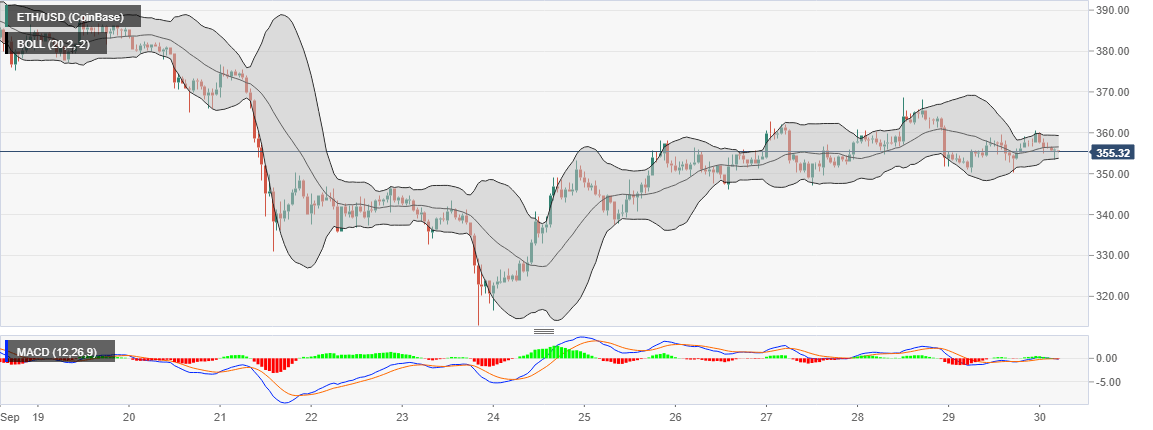
Ethereum stalls under $360 as consolidation takes precedence
The smart contracts giant recently hit a wall at $360. This saw the second-largest cryptocurrency dive to refresh levels at $350. Moreover, a bounce from $350 confirmed the support we explored earlier this week between $346 and $357. Ethereum is trading at $356 amid a push by bulls to send the digital asset above the Bollinger Band middle curve.
Other technical indicators like the Moving Average Convergence Divergence (MACD) are shining a light on the possibility of consolidation taking over. The RSI is leveling at the midline following a minor recovery from -1.2. Subsequently, the constriction of the Bollinger Bands hints volatility is about to hit the roof. Therefore, a breakout above $360 could easily extend the price action to $370 and $380.
ETH/USD 1-hour chart
According to Santiment, a leading platform in on-chain analysis, Ethereum whales have been offloading to the market. Perhaps the selling pressure is what hindered Ether from rising above $360 despite the positive technical picture. Addresses holding between 100,000 and 1,000,000 ETH have declined from 165 on September 25 to 162 on September 30.
Ethereum holder distribution chart
 [08.02.10, 30 Sep, 2020]-637370451240732796.png)
XRP holding above critical support
The fourth-largest cryptocurrency is exchanging hands at $0.241 following a bounce off the support at $0.24. After the dip to $0.22 on September 24, XRP embarked on a recovery path. Substantial gains were accrued, but the bullish momentum lost steam short of $0.25. On the upside, XRP is resting on the support provided by an ascending channel. The trendline must stay intact; otherwise, XRP could dive to $0.2350 and $0.23, respectively.
On the upside, resistance is expected at the 100 SMA, hence the possibility of consolidation taking over. The RSI is moving horizontally under the midline, emphasizing the potential for consolidation taking over.
XRP/USD 1-hour chart
 (69)-637370453557844834.png)
XRP has taken a hiatus after hitting a wall at $0.25. However, Santiment shows whales are still on a buying spree. Consistent growth has been recorded in the number of addresses holding between 10,000 and 100,000 XRP from 97,803 to 101,000. A similar growth pattern has also been recorded by addresses between 100,000 and 1,000,000 from 16,245 to 16,858 over the last 30 days. As buying pressure increases, XRP could pave the way for gains above $0.25.
XRP holder distribution chart
 [08.54.20, 30 Sep, 2020]-637370452056439223.png)
Bitcoin is exploring the levels towards support at $10,600 after failing to sustain the uptrend to $11,000. IntoTheBlock shows BTC holding above an area of immense support (11,400 and $11,700). For now, consolidation is likely to take place before a breakout towards $11,000 is confirmed. On the other hand, Ethereum is stuck below the stubborn resistance at $360. On the flip side, support at $350 is key to the prevailing period of consolidation. Lastly, XRP is trading above the critical support at $0.24, while the upside is limited under the moving averages. Resistance at $0.25 will continue to hinder growth in the coming sessions.
Author

John Isige
FXStreet
John Isige is a seasoned cryptocurrency journalist and markets analyst committed to delivering high-quality, actionable insights tailored to traders, investors, and crypto enthusiasts. He enjoys deep dives into emerging Web3 tren


