Toncoin price on the verge of breaking out, could rally 24%
- Toncoin price is currently forming a cup and handle pattern, a bullish sign.
- On-chain data suggests a rising demand for TON, with whales actively accumulating.
- A daily candlestick close below $6.01 would invalidate the bullish thesis.

Toncoin (TON) price is currently forming a cup and handle pattern, which is a bullish continuation configuration. On-chain data indicates a surge in TON's influx of new investors, alongside notable whale accumulation, potentially propelling prices to surge by 24%.
Toncoin price on a move to a breakout
Toncoin price action between mid-April and early June resulted in the formation of a Cup and Handle pattern. The U-shaped bottom formation between mid-April and mid-May led to the creation of the cup, and the smaller U-shaped bottom is termed as the handle. Hence, the namesake.
Assuming Toncoin price breaks above the $7.70 hurdle, this bullish continuation pattern forecasts a 41% rally to $10.85, obtained by adding the depth of the cup to the breakout point.
This outlook is extremely bullish and is unlikely to be achieved, considering the current market conditions. Investors can remain conservative by only entering this position after TON produces a daily candlestick close above the $7.70 level. Beyond this, market participants can start booking profits around the 161.8% Fibonacci extension level at $9.61.This move would constitute a 24% gain.
If the outlook remains bullish beyond $9.61, Toncoin price could extend the rally by an additional 13% at $10.85.
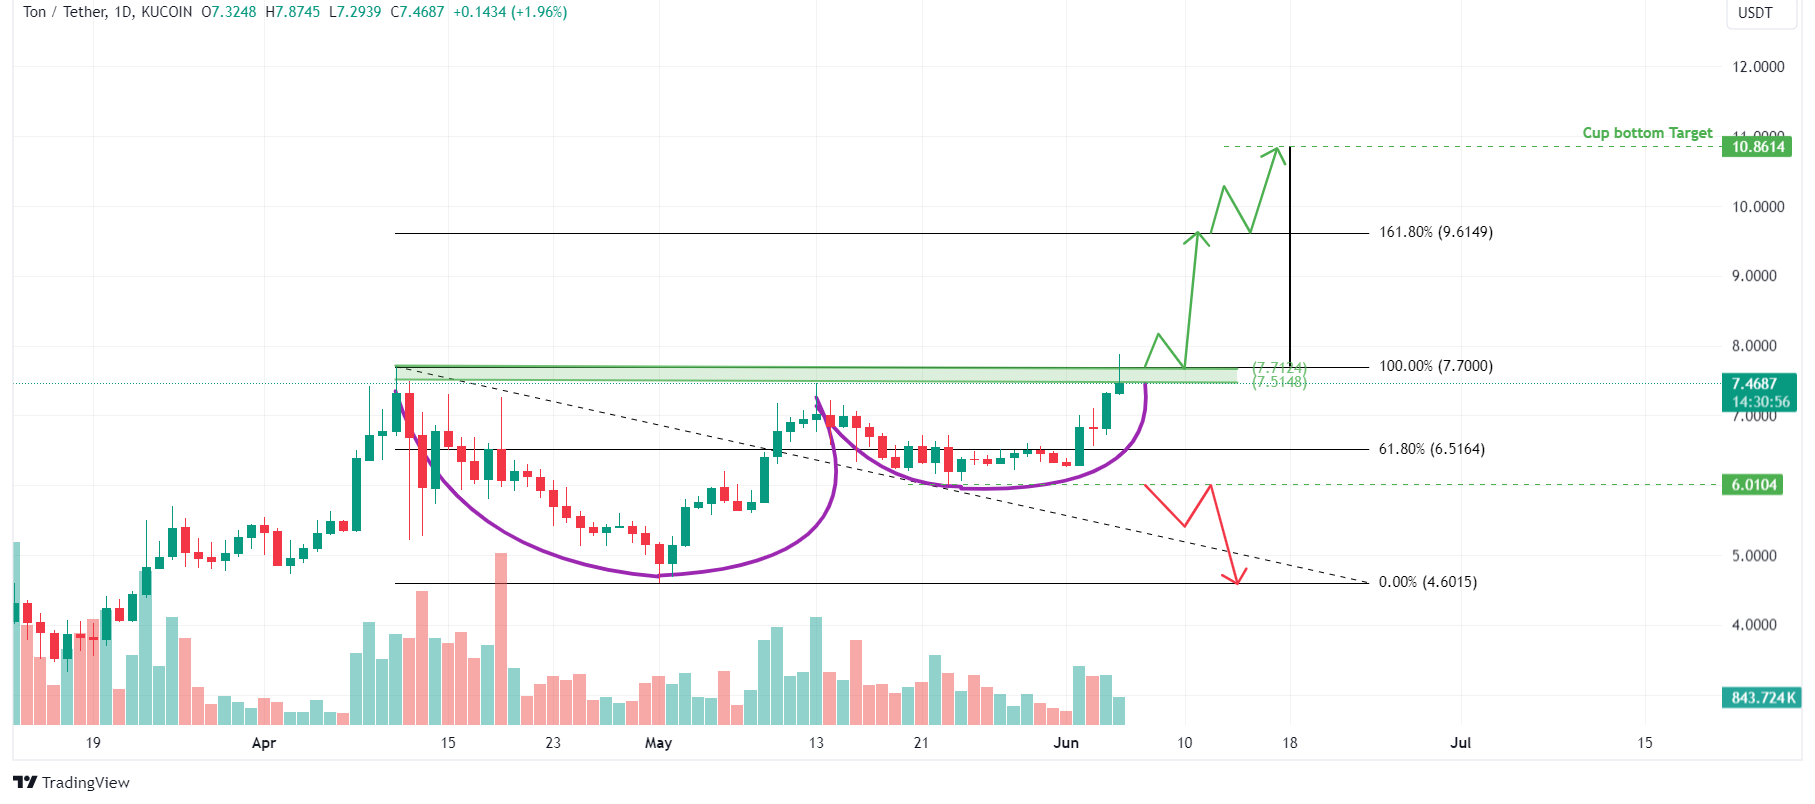
TON/USDT 1-day chart
Santiment’s data on Supply held by top non-exchange addresses shows the combined balance of the top 100 addresses that don’t belong to exchanges. A rise in this metric indicates that the whales are accumulating, while a fall indicates that the whales are selling.
In Toncoin’s case, the metric shows a rise, indicating that the high net-worth investors are buying TON. This analysis is also supported by the spikes in the Whale Transaction Count metric during the early June crash. This index tracks transactions by large-wallet investors worth $100,000 or more. An uptick in this indicator during a dip could suggest whales are accumulating. On the other hand, it could serve as a top formation if it occurs after a rally.
%20[13.10.26,%2005%20Jun,%202024]-638531828741811138.png)
TON Supply held by top non-exchange addresses chart
On-chain data from IntoTheBlock adds a bullish view for Toncoin. The number of new addresses increased from 97 on May 31 to 270 on June 4, implying a proxy of new money and demand coming into TON network.
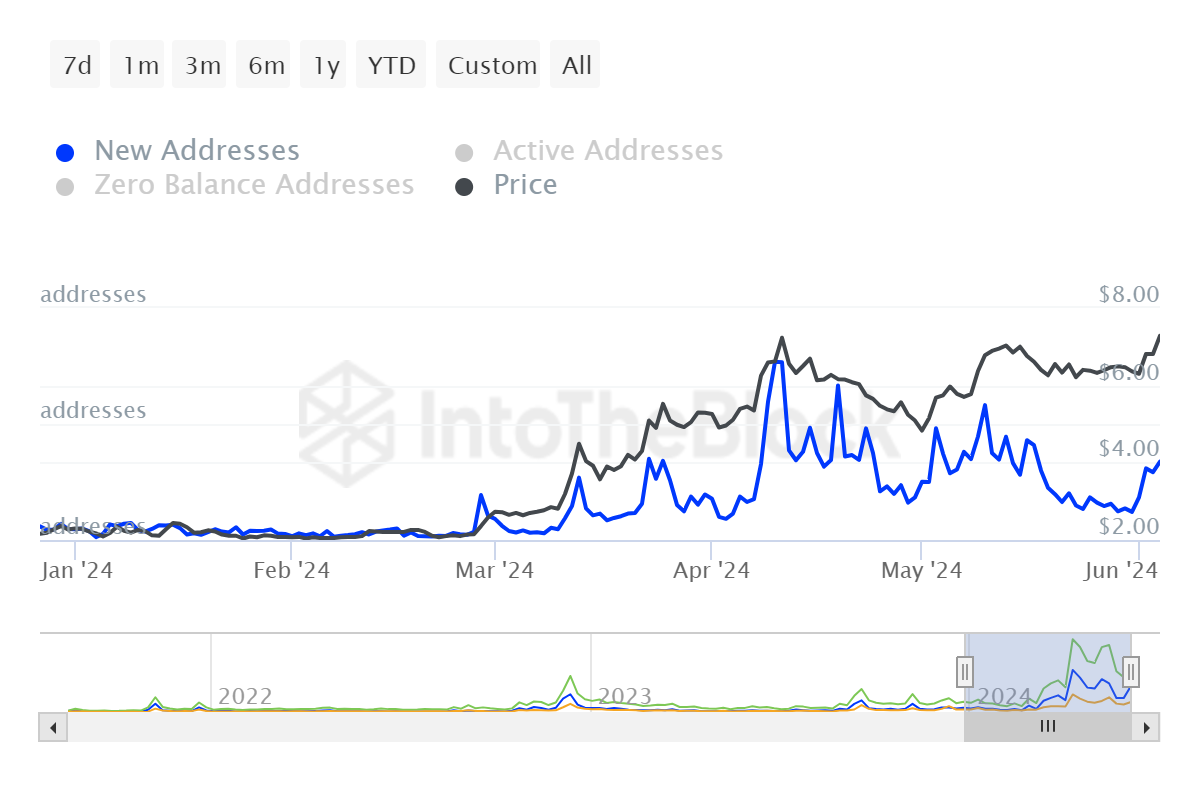
TON Daily New Addresses chart
Despite strong technical analysis and on-chain data, if the Toncoin price produces a daily candlestick close below $6.01, it would invalidate the bullish thesis by producing a lower low on a daily time frame. This development could see the TON price fall 23% to the next key support level of $4.60.
Author

Manish Chhetri
FXStreet
Manish Chhetri is a crypto specialist with over four years of experience in the cryptocurrency industry.



