This Solana price consolidation foreshadows 70% bullish breakout
- Solana price has formed an inverse head-and-shoulders setup, forecastina a trend reversal.
- The setup forecasts a 70% upswing to $37.21 which could extend to $38.92 in a highly bullish case.
- Invalidation of the optimistic outlook will occur on the flip of the $18.66 support level.

Solana price edges closer to a multi-month breakout that could be a sight to behold, especially for SOL holders. A successful breakout could net investors a handsome profit as the alt season narrative picks up steam.
Also read: Solana price to be burned by 10% drop as SOL bulls play with fire
Solana price ready to explode
Solana price reveals an inverse head-and-shoulders formation that has been in formation for nearly a year. This technical formation is a bottom reversal setup and contains three distinctive swing lows.
The central trough is termed the head and is lower than the other two troughs, named shoulders. Hence the namesake inverse head-and-shoulders. A trendline connecting the peaks of these swing lows shows a strong declining resistance level which is often referred a neckline.
A decisive close above the neckline confirms a bullish breakout of the inverse head-and-shoulders pattern. This technical formation forecasts a 71.09% upswing to $37.21, obtained by adding the distance between the right shoulder’s peak and the head’s lowest point.
As of April 8, Solana price consolidation just below the neckline has gotten tighter over hte last three weeks or so. This rangebound movement indicates a period of low volatility, and breakouts are often associated with high volatility. Hence, a three-day candlestick close that breaches the one-year trendline could catalyze a rally for Solana price.
Additionally, sustenance of the bullish momentum after hitting the theoretical target of $37.21 SOL could attempt to sweep the $38.92 level to collect buy-stops, bringing the total gain to roughly 80%.
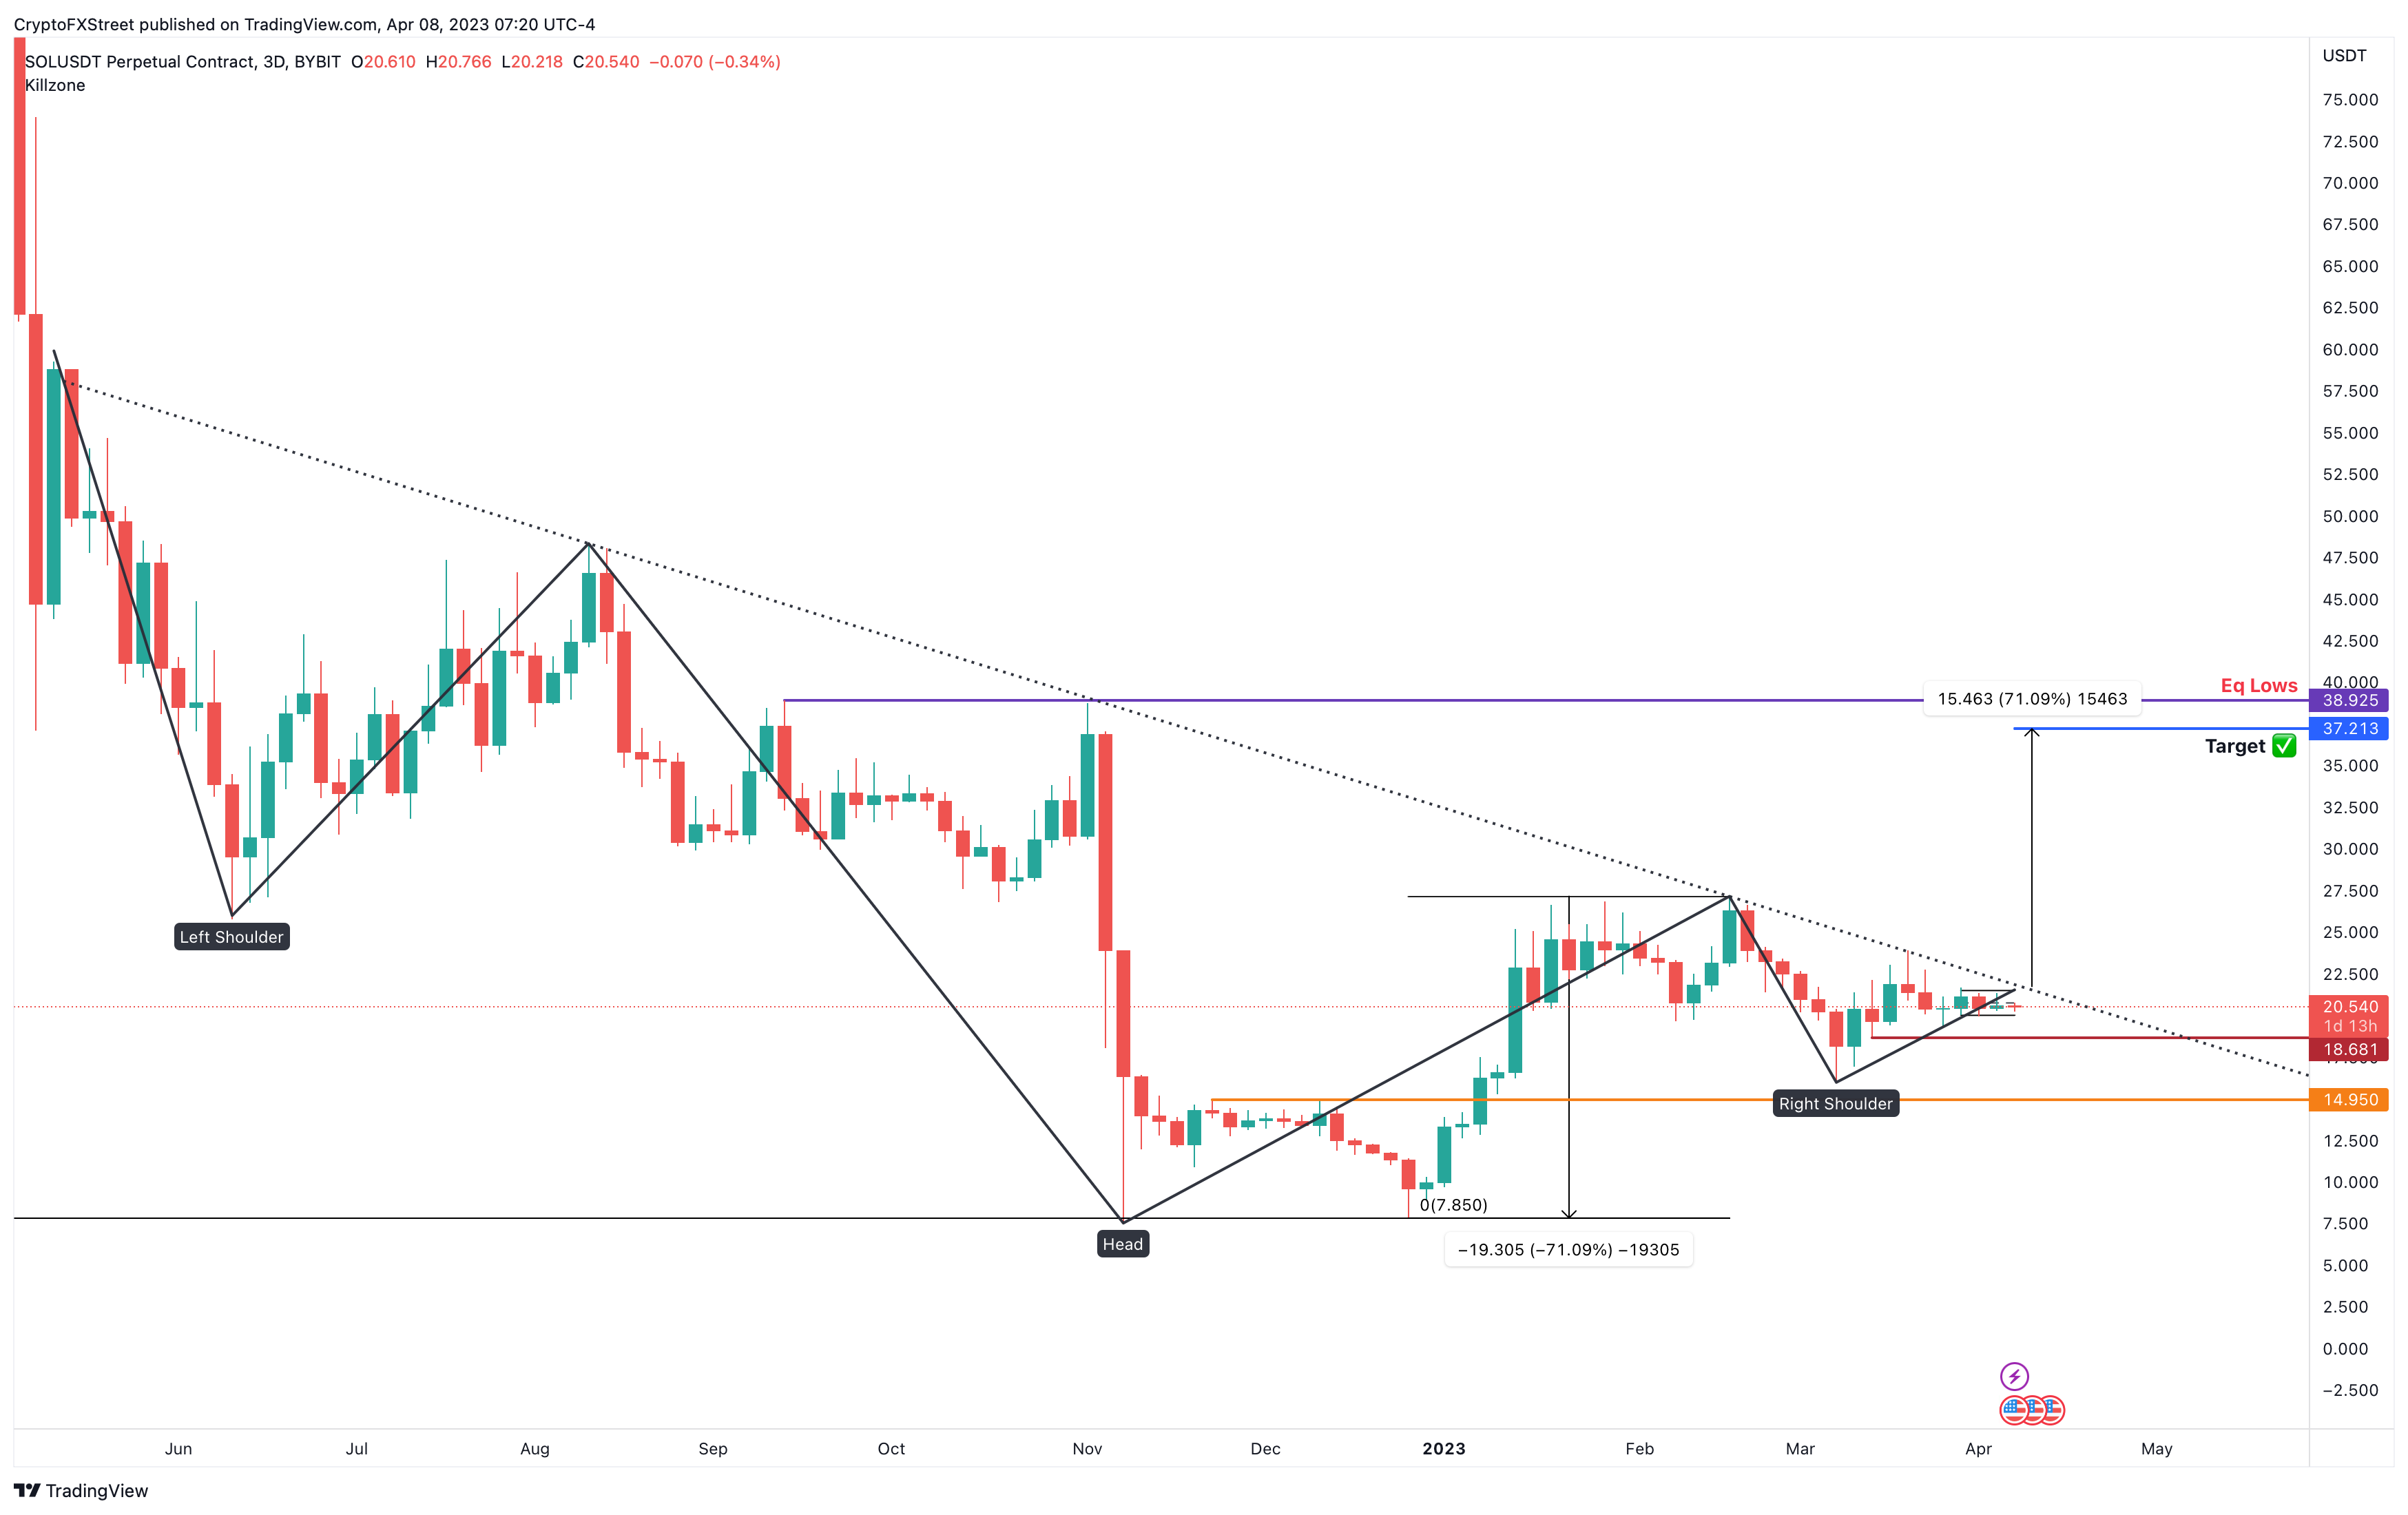
SOL/USDT 3-day chart
The invalidation of this outlook is clear; a breakdown of the $18.66 support level will skew the odds in the bears’ favor. Such a development could see Solana price slide down to $14.95 barrier.
Author

Akash Girimath
FXStreet
Akash Girimath is a Mechanical Engineer interested in the chaos of the financial markets. Trying to make sense of this convoluted yet fascinating space, he switched his engineering job to become a crypto reporter and analyst.