Solana price edges closer to 70% breakout as SOL attempts to breach multi-month resistance
- Solana price reveals an inverse head-and-shoulders setup, forecasting a 71.09% upswing to $37.21.
- A successful bullish breakout could push SOL beyond the pattern’s 70% target to equal highs at $38.92.
- A daily candlestick close below the $18.68 support level will invalidate the bullish thesis for SOL.

Solana price is actively attempting to breach a crucial hurdle that has persisted for more than a year. A successful breakout from this level could yield massive gains for SOL holders.
Additionally, looking at the dominance of Bitcoin and altcoins reveal that capital rotation is more than due.
finally https://t.co/BsHnYFVD4l pic.twitter.com/t54o0wkkIA
— Akash (@Mangyek0) April 5, 2023
Read more: Here are top three altcoin categories that are likely to pump the hardest in the 2023 alt season
Solana price ready to make hay
Solana price shows an inverse head-and-shoulders formation on the daily timeframe. This technical formation contains three distinctive swing lows, with the central trough lower than the other two. The variant in the middle is termed head and the troughs on either side are named shoulders. Hence the namesake inverse head-and-shoulders. Connecting the peaks of these swing lows using a trendline reveals a declining resistance level termed a neckline.
A successful flip of the neckline indicates a breakout for the technical formation, which forecasts a 71.09% upswing to $37.21. The target is obtained by adding the distance between the point connecting the right shoulder’s peak and the head’s lowest point, as seen in the chart below.
So far, Solana price has been unsuccessful in breaching the one-year trendline, but due to the potential spike in investors’ confidence in altcoins, a rally for Solana price is on the cards.
If SOL reaches its theoretical target at $37.21 and momentum stays relatively strong, it could attempt to collect the buy-stop liquidity resting above the equal highs formed at $38.92. This move would constitute an 80% upswing.
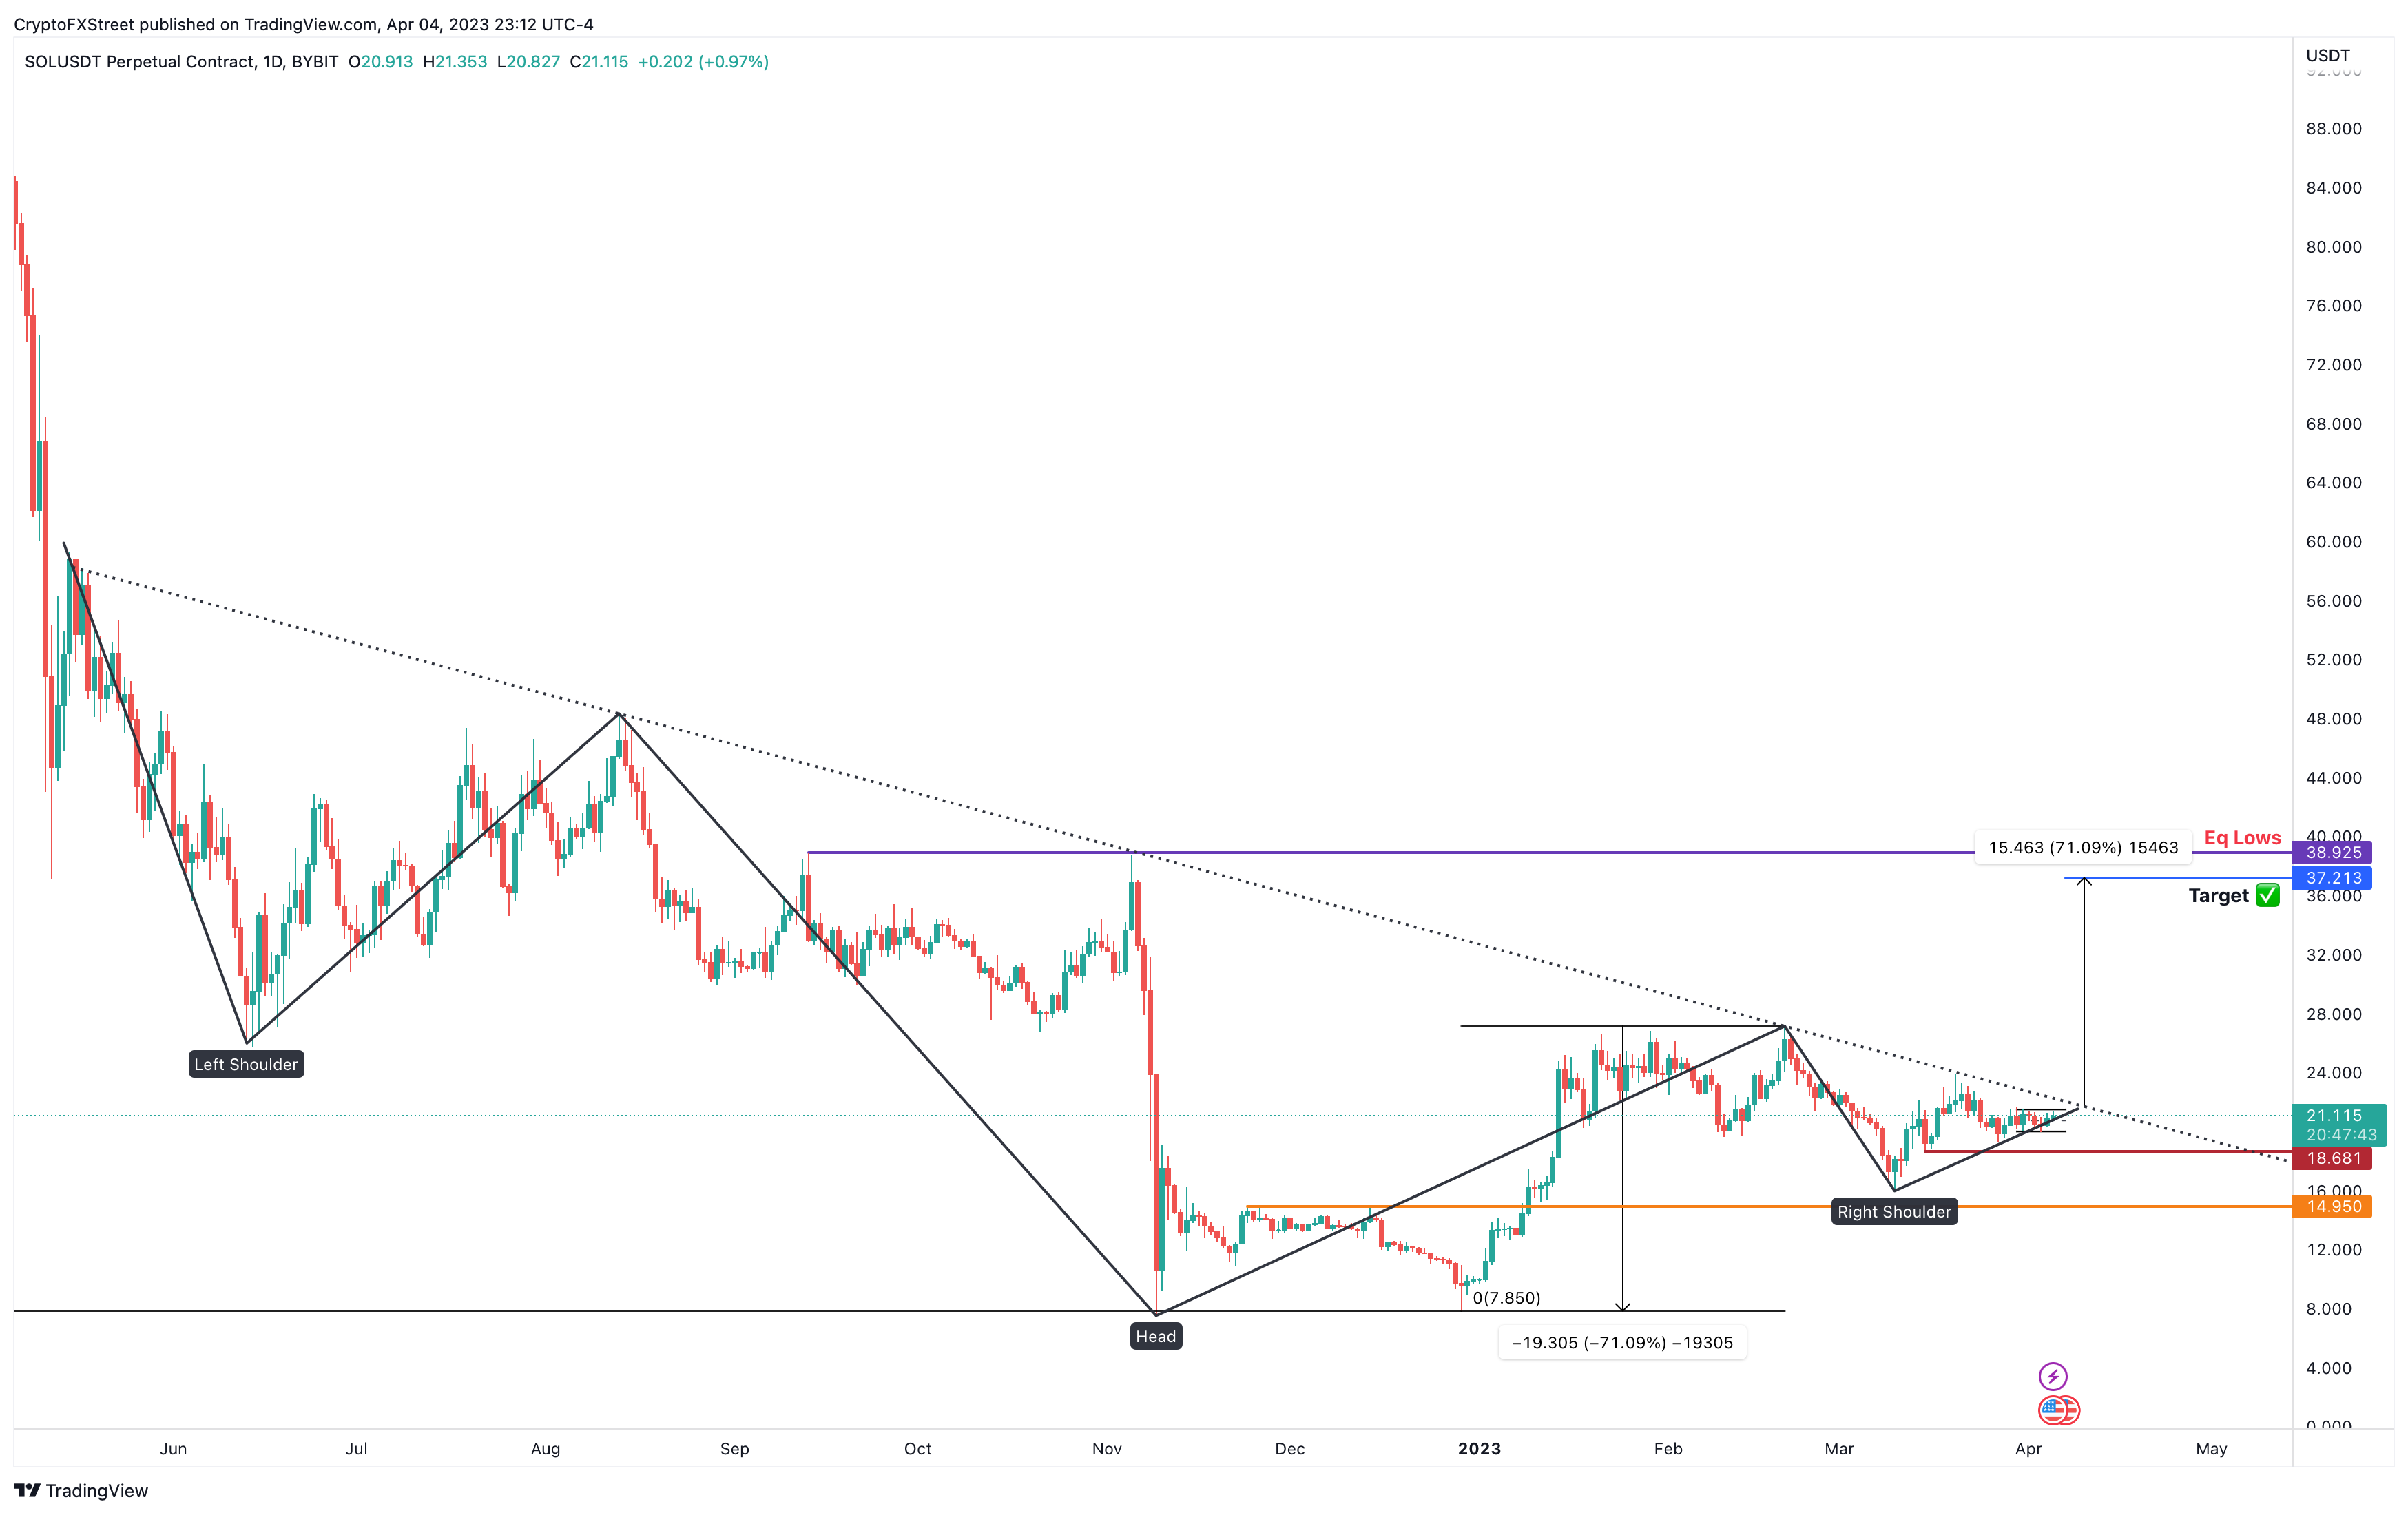
SOL/USDT 1-day chart
While things are looking interesting for altcoins in general, a high-impact macroeconomic event that tanks the stock markets could negatively impact the cryptos. If such a scenario were to play out that pushes Solana price below the $18.68 support level to produce a lower low, it would invalidate the bullish thesis for SOL.
Such a move would skew the odds in bears favor and potentially trigger a Solana price sell-off into $14.95.
Author

Akash Girimath
FXStreet
Akash Girimath is a Mechanical Engineer interested in the chaos of the financial markets. Trying to make sense of this convoluted yet fascinating space, he switched his engineering job to become a crypto reporter and analyst.



