These are the technical forces that can determine where Cardano’s ADA price will go next
- Cardano price has formed a bearish pattern that confirms the downtrend.
- ADA price is set to touch the low of the year for a retest.
- With the start of July, the repricing of the pivots reveals a consolidation with a breakout in the near term.

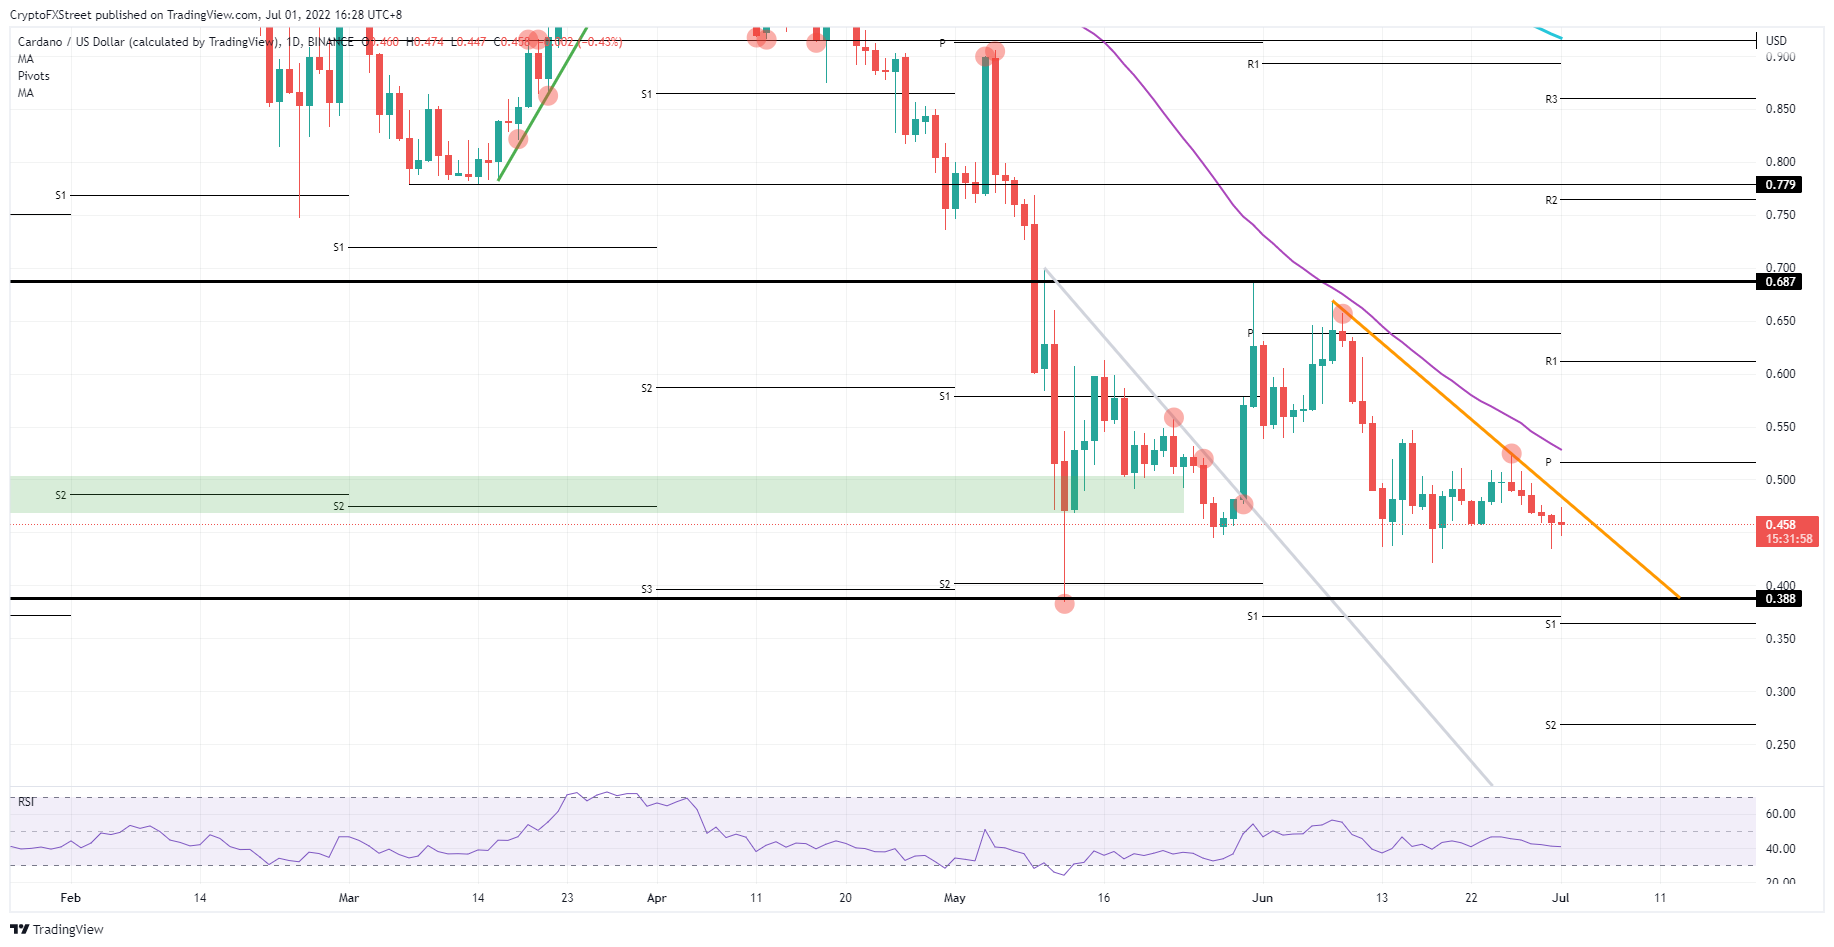
Cardano (ADA) price has two key technical elements that need to be pointed out to traders of the cryptocurrency. The first item is the bearish triangle with the tilted edge running alongside the 55-day Simple Moving Average. The second item is that at the start of the new month, the monthly pivots have been repriced and the room between them is now narrower pointing to consolidation and a possible breakout in the near term.
ADA price facing two technical forces
Cardano price is revealing a glimpse of what is coming up in the days and weeks of the first month of summer. A bearish triangle has formed on the chart adding additional bearish pressure to the already battered ADA price action. A drop to the downside and a test of $0.388 looks almost inevitable as the bearish death cross and current market sentiment point to a negative outlook.
ADA price could, however, start to see a slowdown in volatility as the new monthly pivots for July are falling very close to one another compared to the spread between the pivots in June. This means that price is consolidating, and buyers and sellers are getting squeezed towards one another. Should $0.388 not hold, the new S1 support right below is offering itself at $0.364 to catch any price action, while the Relative Strength Index (RSI) is nearing the ‘oversold’ barrier again.
ADA/USD daily chart
Any attempt by bulls to orchestrate a breakout needs to be accompanied by a penetration of the sloping side of the triangle. The risk to be aware of is that this could be a bull trap with the 55-day Simple Moving Average as the risk factor muting price action. If bulls can break this technical hurdle as well, however, expect to see a massive upswing that could even reach $0.687.
Author

Filip Lagaart
FXStreet
Filip Lagaart is a former sales/trader with over 15 years of financial markets expertise under its belt.


