The Graph Price Prediction: GRT to go ballistic once this barrier breaks
- TheGraph price is contained inside a descending triangle pattern on the 4-hour chart.
- A key indicator has presented a buy signal that gives a lot of credence to the bulls.
- A breakout above $2.15 will drive GRT towards $2.8 in the short-term.

TheGraph price has recently established a new all-time high at $2.88 on February 12 after a successful token sale conducted on October 2020 at the price of $0.03 per token. The digital asset seems ready for another leg up to establish new highs.
TheGraph price on the verge of a 30% breakout
On the 4-hour chart, GRT has established a descending triangle pattern which is on the brink of a breakout. The key resistance trendline is located at $2.15. A breakout above this point will drive TheGraph price up to $2.8, a 30% move calculated by using the height of the pattern as a reference point.
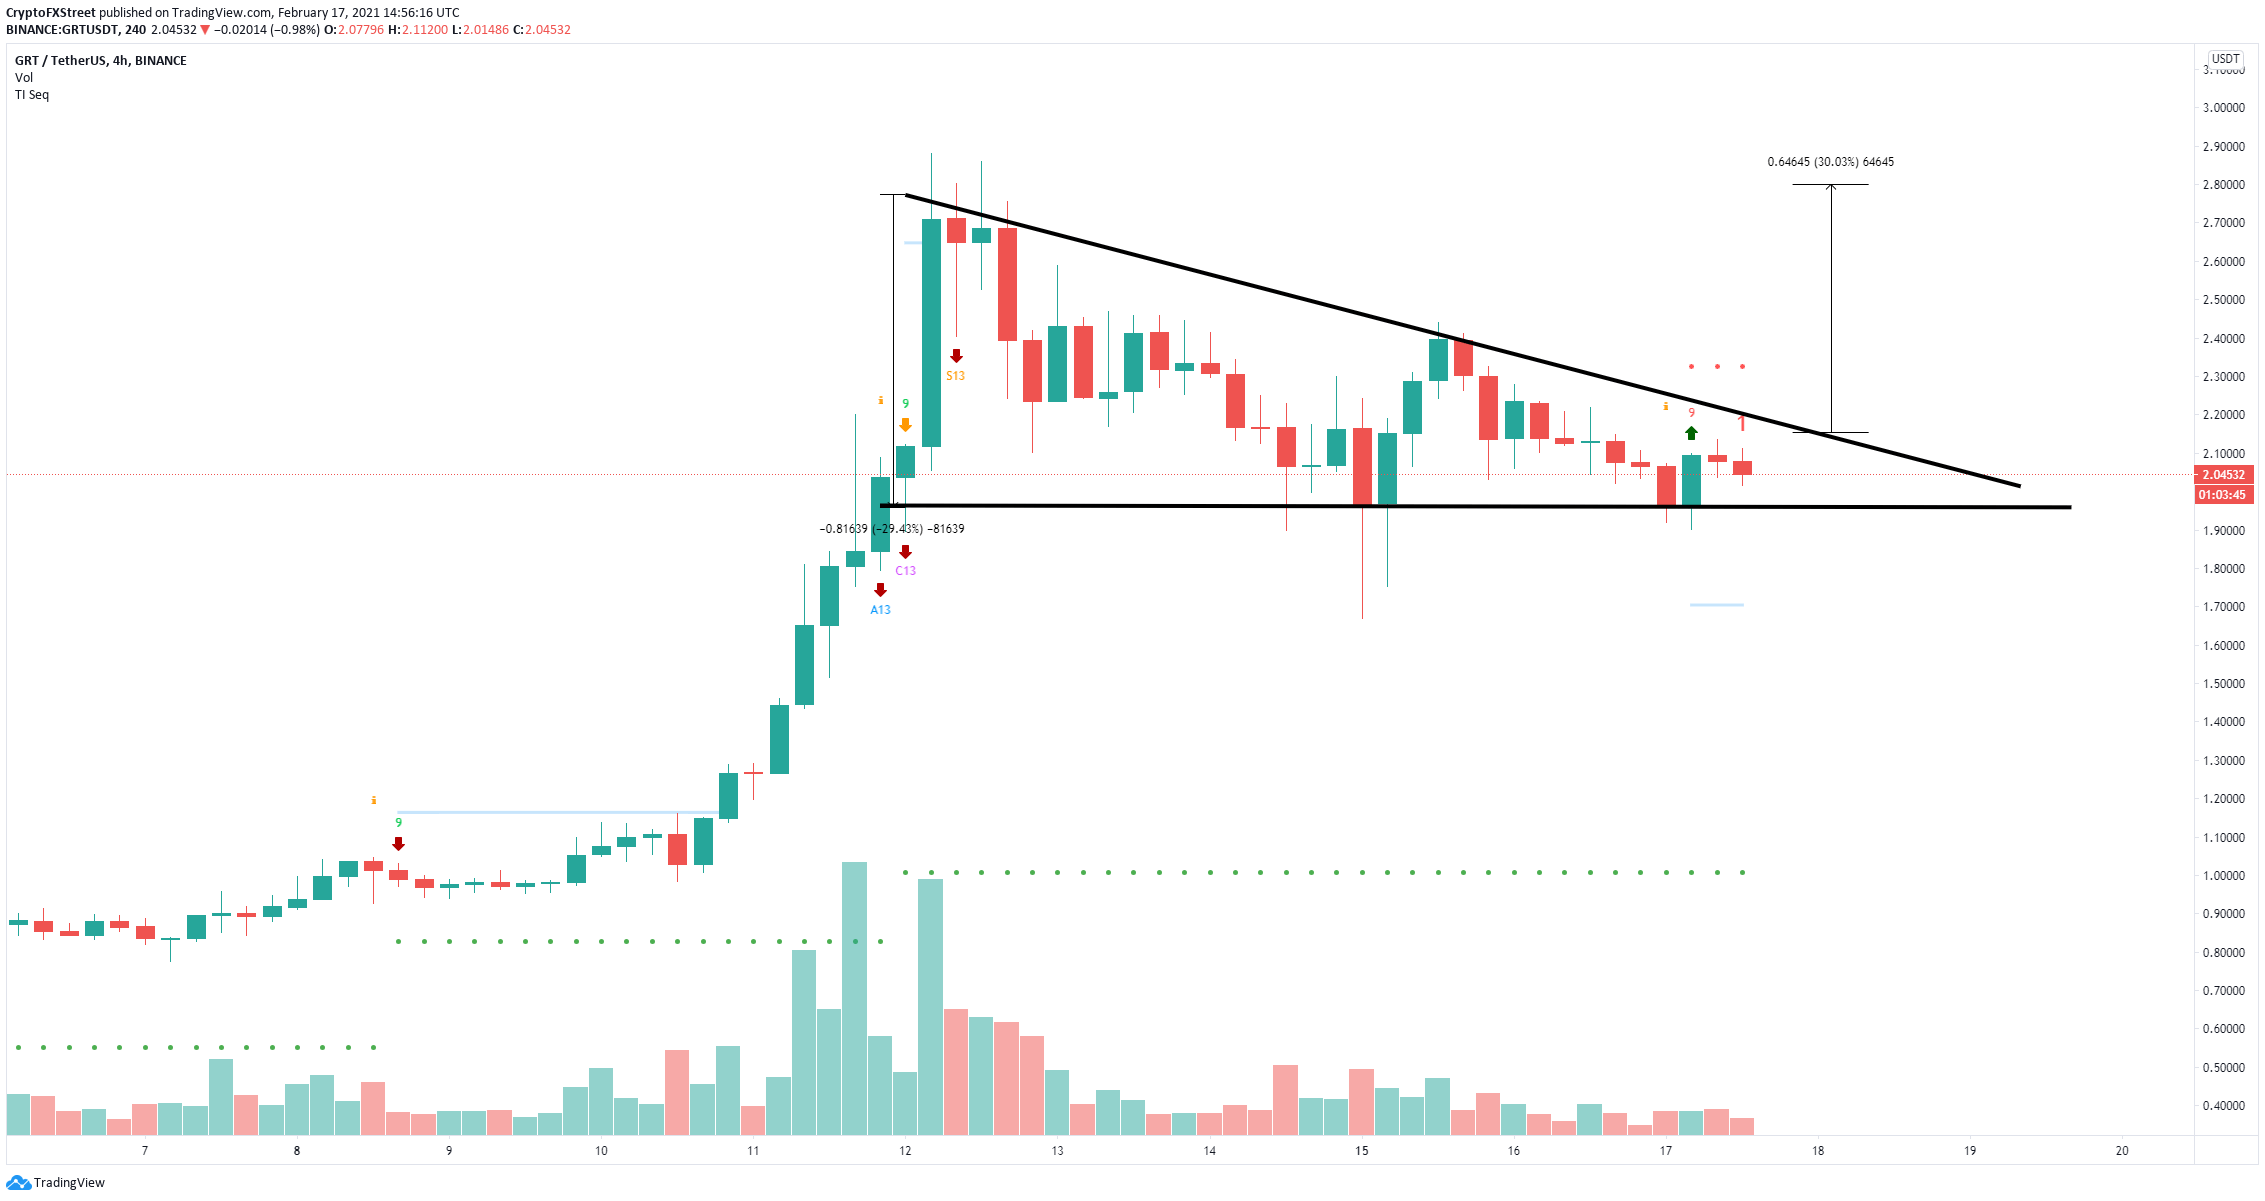
GRT/USD 4-hour chart
Additionally, the TD Sequential indicator has presented a buy signal several hours ago which hasn’t been invalidated yet and should add credence to the bullish outlook, especially after GRT bulls defended the lower trendline support at $1.96.
%20[15.51.20,%2017%20Feb,%202021]-637491708360656805.png)
GRT Holders Distribution
However, on-chain metrics show that GRT is losing a lot of strength. The number of large holders with 100,000 to 1,000,000 GRT tokens ($200,000 to 2,000,000) has significantly declined from 513 on February 2 to only 342 now. Similarly, the amount of whales holding between 1,000,000 and 10,000,000 coins ($2,000,000 and $20,000,000) also dropped from 63 to 54.
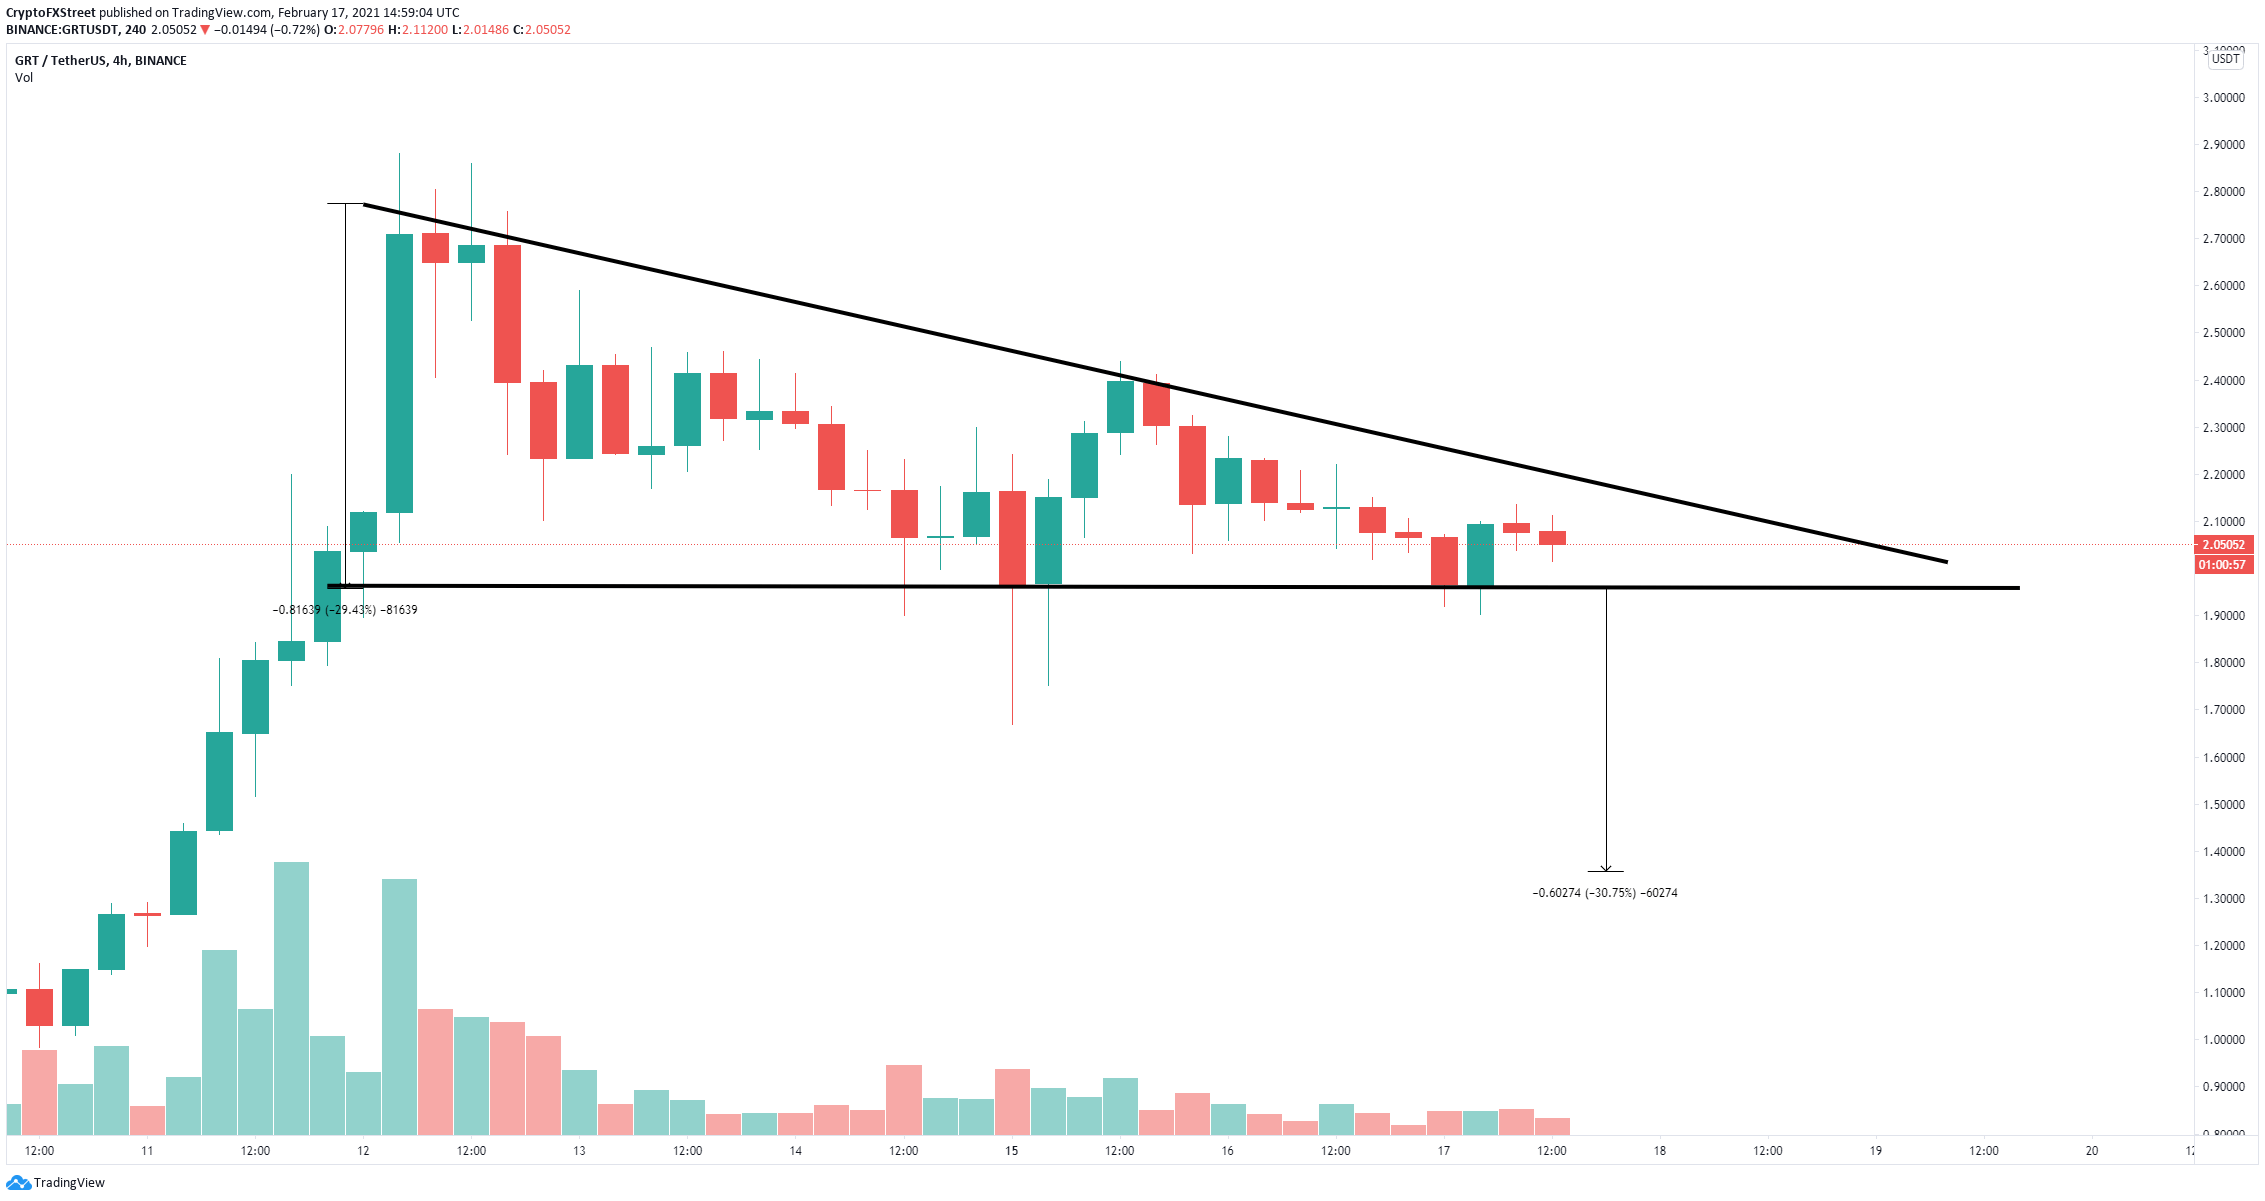
GRT/USD 4-hour chart
This indicates that large holders are exiting their positions and taking profits as they expect a potential correction. If the support level at $1.96 fails to hold, TheGraph price can quickly fall towards $1.35.
Author

Lorenzo Stroe
Independent Analyst
Lorenzo is an experienced Technical Analyst and Content Writer who has been working in the cryptocurrency industry since 2012. He also has a passion for trading.




