The Graph Price Prediction: GRT future is defined by these two crucial levels
- The Graph price shows the formation of a bull flag pattern on the 4-hour chart.
- A decisive close above bull flag’s upper trendline projects GRT 65%-to-185% price surge in the mid-to-long term.
- The bullish thesis could be invalidated if GRT price slices through the flag’s lower trendline around the $1.72 level.

The Graph price has seen a massive 190% rally since February 10. However, due to the slowdown of the cryptocurrency market, GRT has consolidated into a bull flag formation awaiting a clear breakout.
The Graph price primed for a massive rally
The Graph price has dipped into a consolidation pattern since February 12 after a brief but explosive rally, forming a bull flag.
A bull flag is a momentum-based pattern, where the price first explodes with high volume forming a “flag pole”. This rally then is followed by a consolidation, creating the “flag”.
The breakout from the flag continues in the direction of the previous price trend. Therefore, these patterns are called continuation patterns. The target for such a technical setup is the distance between the pattern's high and the flagpole's base measured from the breakout point.
In GRT's case, the first target is a 65% surge measured from the top of the pole to the bottom which coincides with the 127.2% Fibonacci retracement level. The second is a 180% surge measured in the opposite direction or the 261.8% Fibonacci level.
These targets are $3.35 and $5.90, respectively.
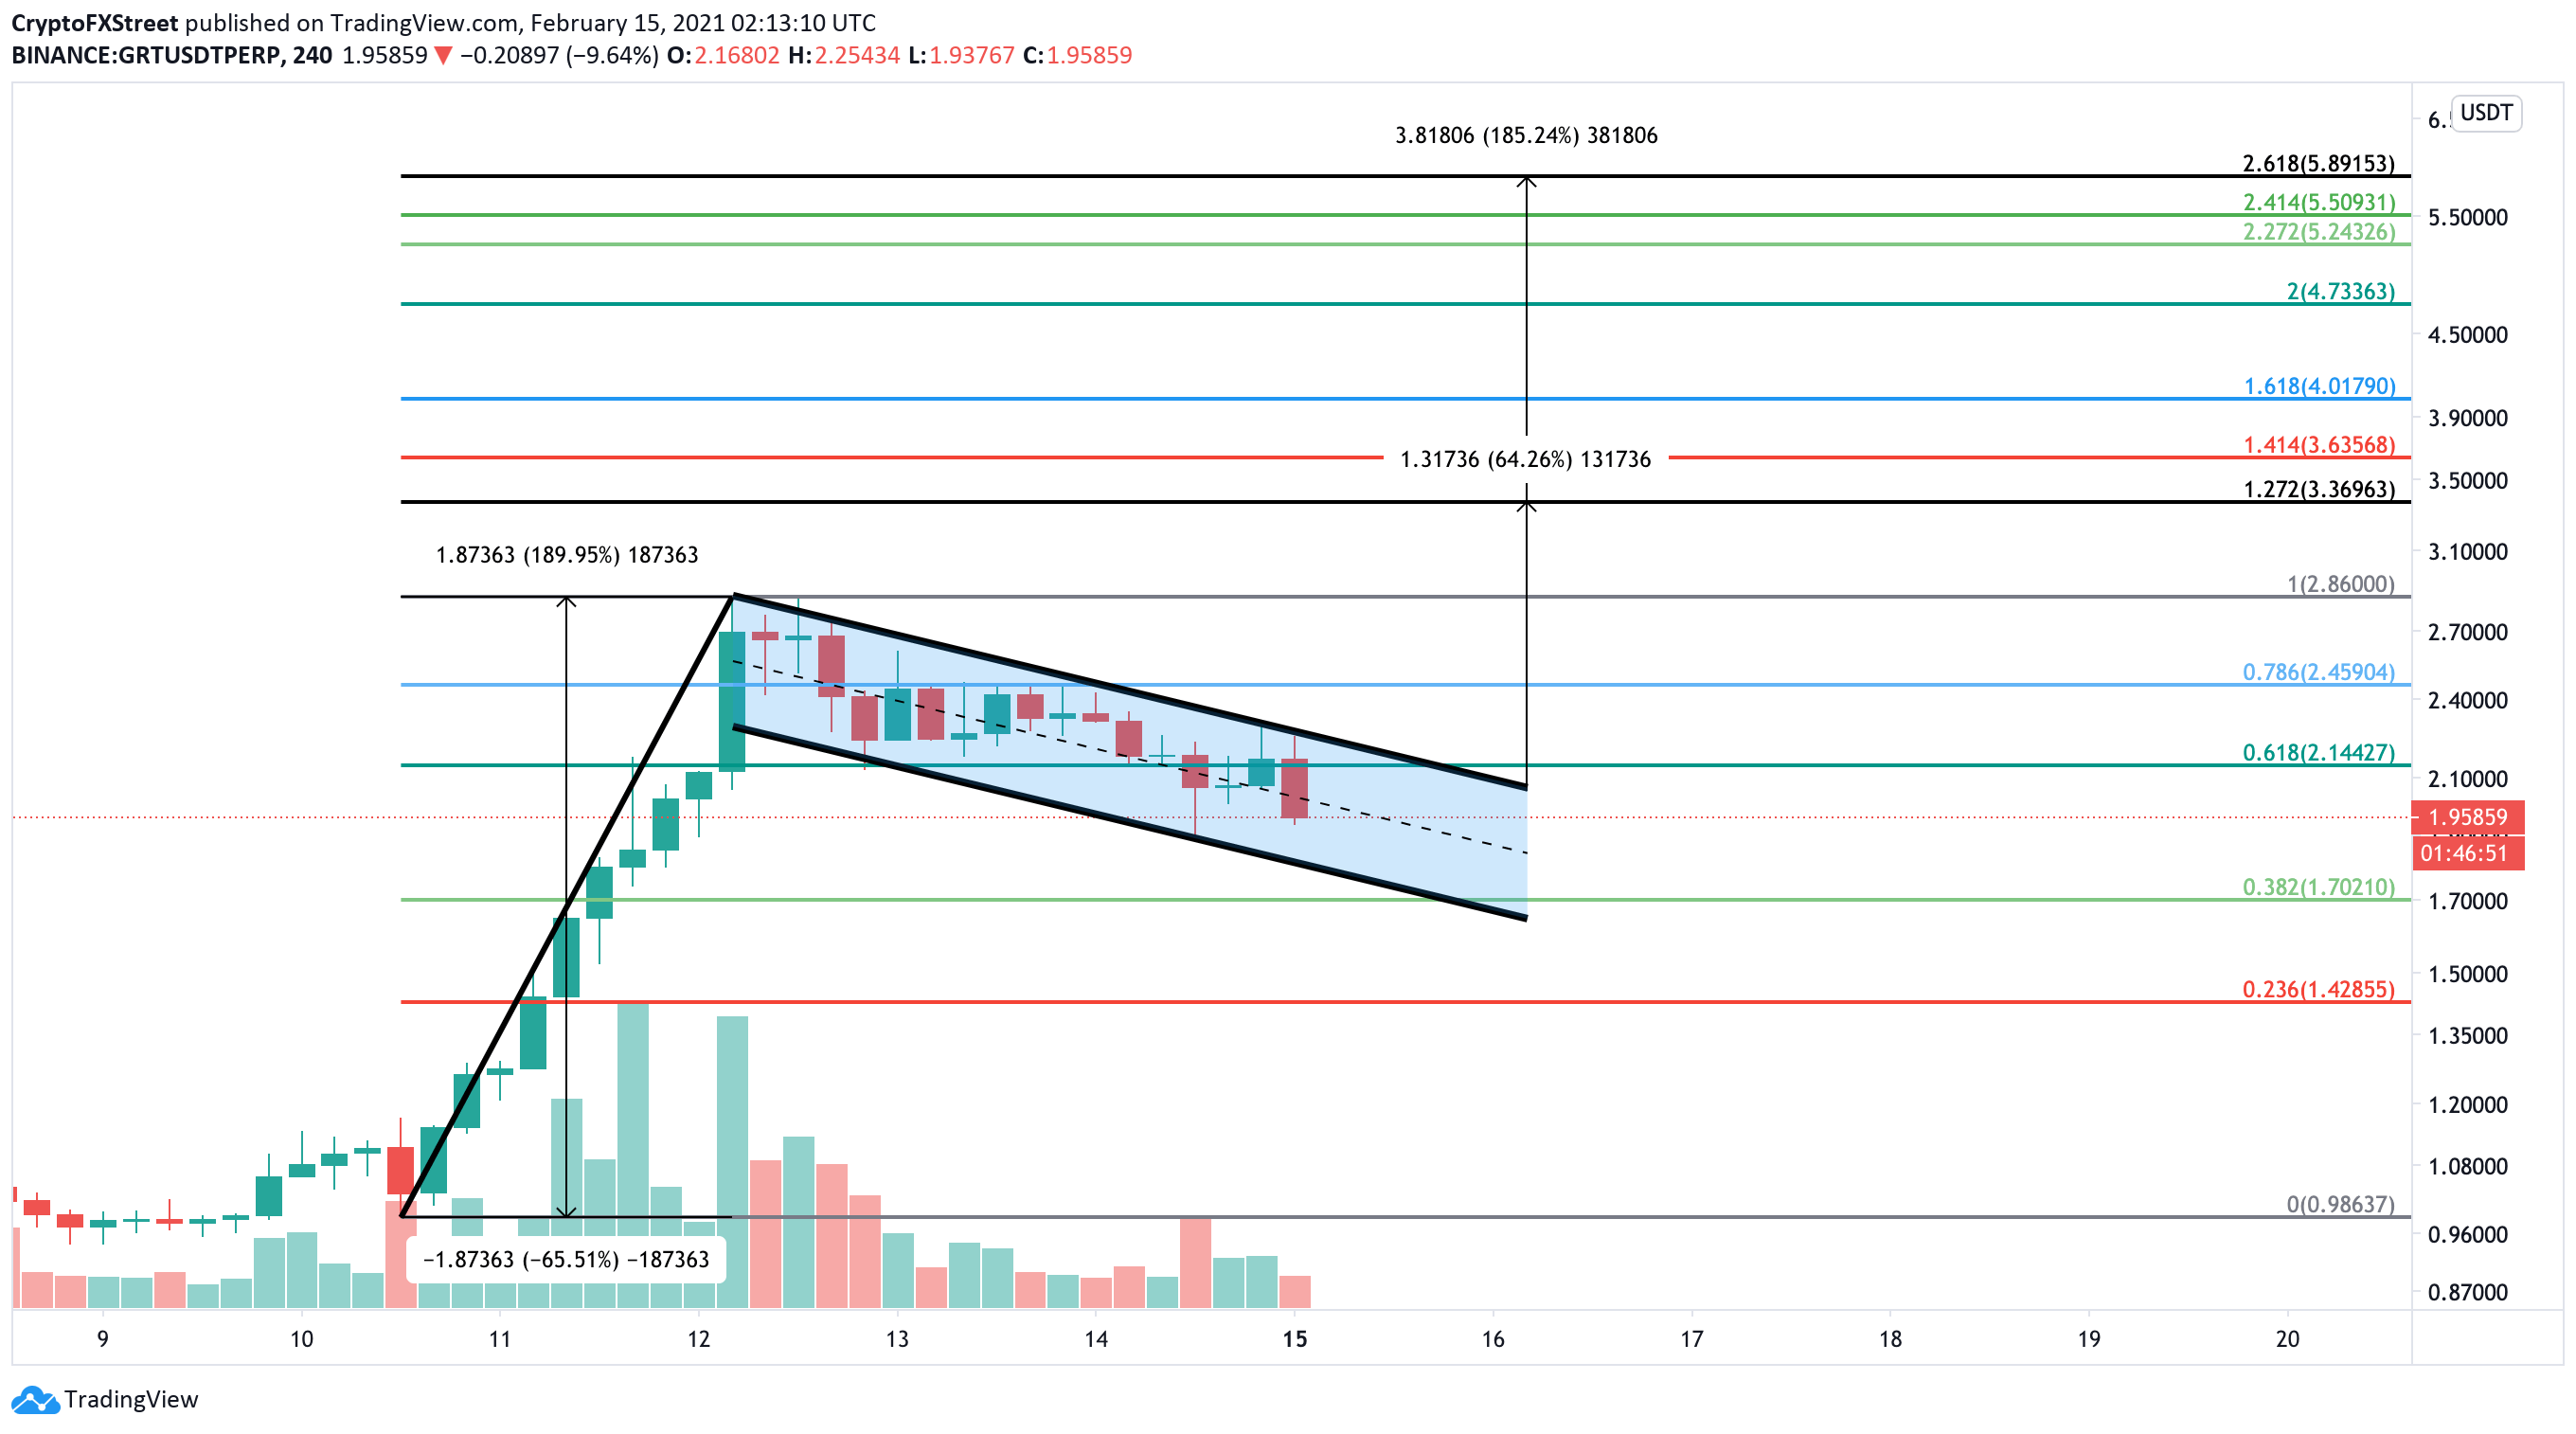
GRT/USDT 4-hour chart
It is worth mentioning that a failure to close above the flag’s upper trendline could send the token towards the support barrier at $1.65. Moreover, a breakdown of the flag invalidate GRT’s bullish thesis and trigger a sell-off towards the $1.1 level.
Author

Akash Girimath
FXStreet
Akash Girimath is a Mechanical Engineer interested in the chaos of the financial markets. Trying to make sense of this convoluted yet fascinating space, he switched his engineering job to become a crypto reporter and analyst.


