Tezos price traps bulls, here's what could happen next
- Tezos price trades at the lower half of the range after completely reversing the previous uptrend spike.
- On-chain metrics show bears are in profit while bulls have yet to capitulate.
- Invalidation of the bearish thesis is a breach above $1.45.

Tezo's XTZ price could become problematic for investors as the price is falling rapidly during the second trading week of November. Furthermore, on-chain metrics hint that a volatile move could arise. Key levels have been defined to gauge XTZ's next potential move.
Traders should keep the digital asset on their watchlists in the coming days.
Tezos price in limbo
Tezos price could be setting up for a sweep-the-lows event in the coming hours after a 5% spike on Friday, November 4. The highly scalable blockchain token completely reversed throughout the weekend, printing prices below the $1.50 zone.
Tezos price currently auctions at $1.35 as the bears are producing a penny-from-Eiffel-style decline on smaller time frames. The move south was catalyzed by a breach of the 8-day exponential moving average. The 21-day simple moving average failed to provide support shortly after. If market conditions persist, a sweep of the lows at $1.29 will be the first bearish target, and the October 12 swing low at 1.26 may also be in jeopardy.
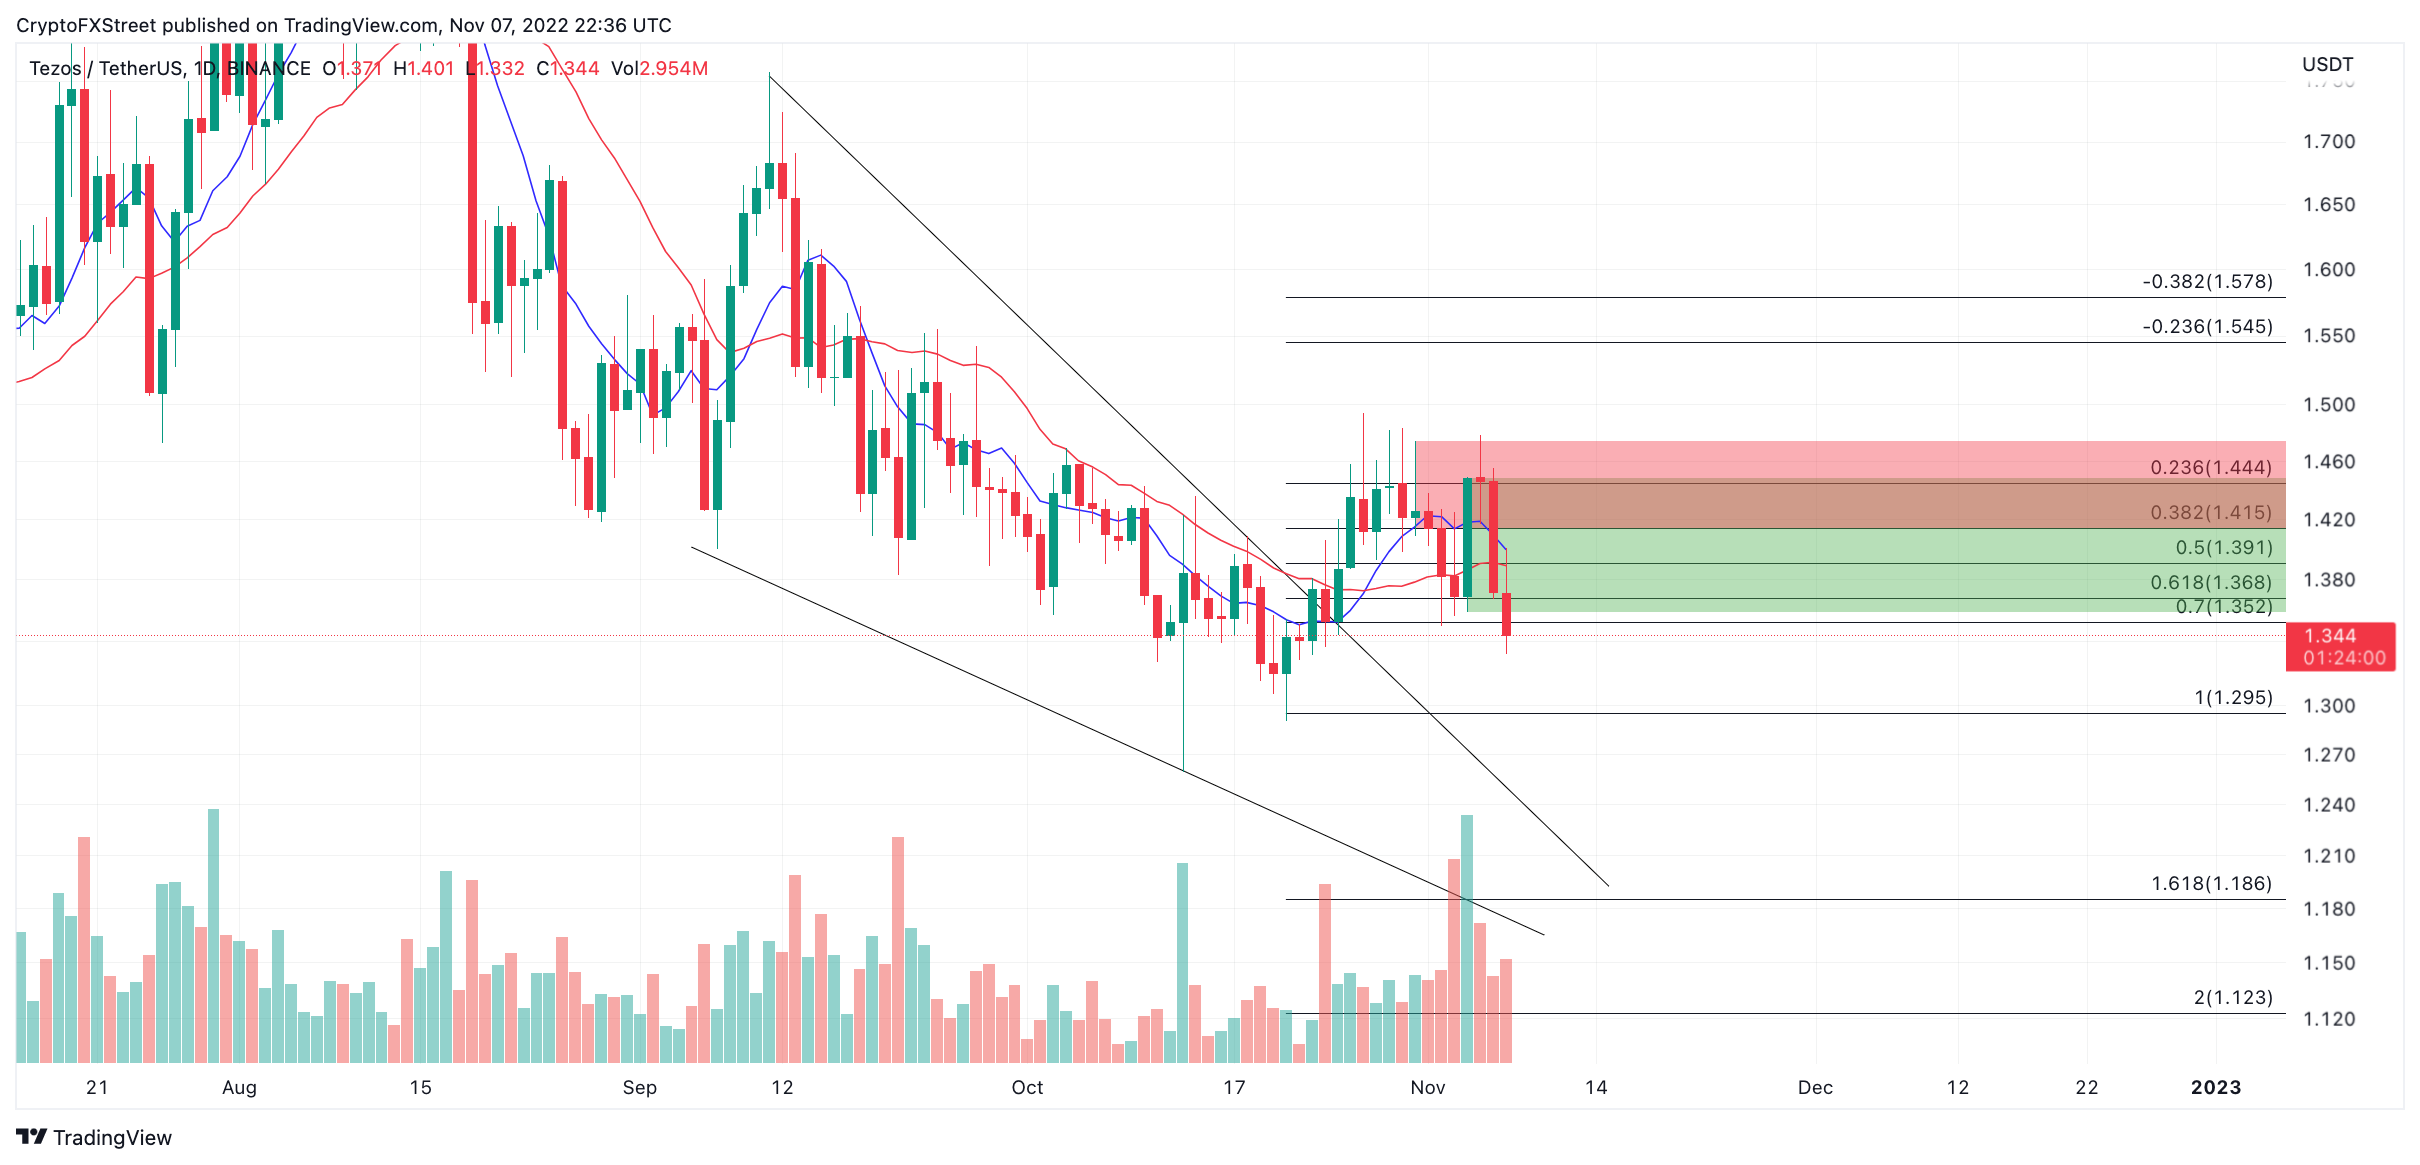
XTZUSDT 1-Day Chart
Coinglass's Long vs. Short Ratio Indicator compounds the bearish idea. According to the indicator, 75% of all XTZ traders opened a long position during the rally on Friday, November 4. Tezos price traded between $1.35 and $1.44 at the time, which means bulls have much more decline to endure before capitulating.
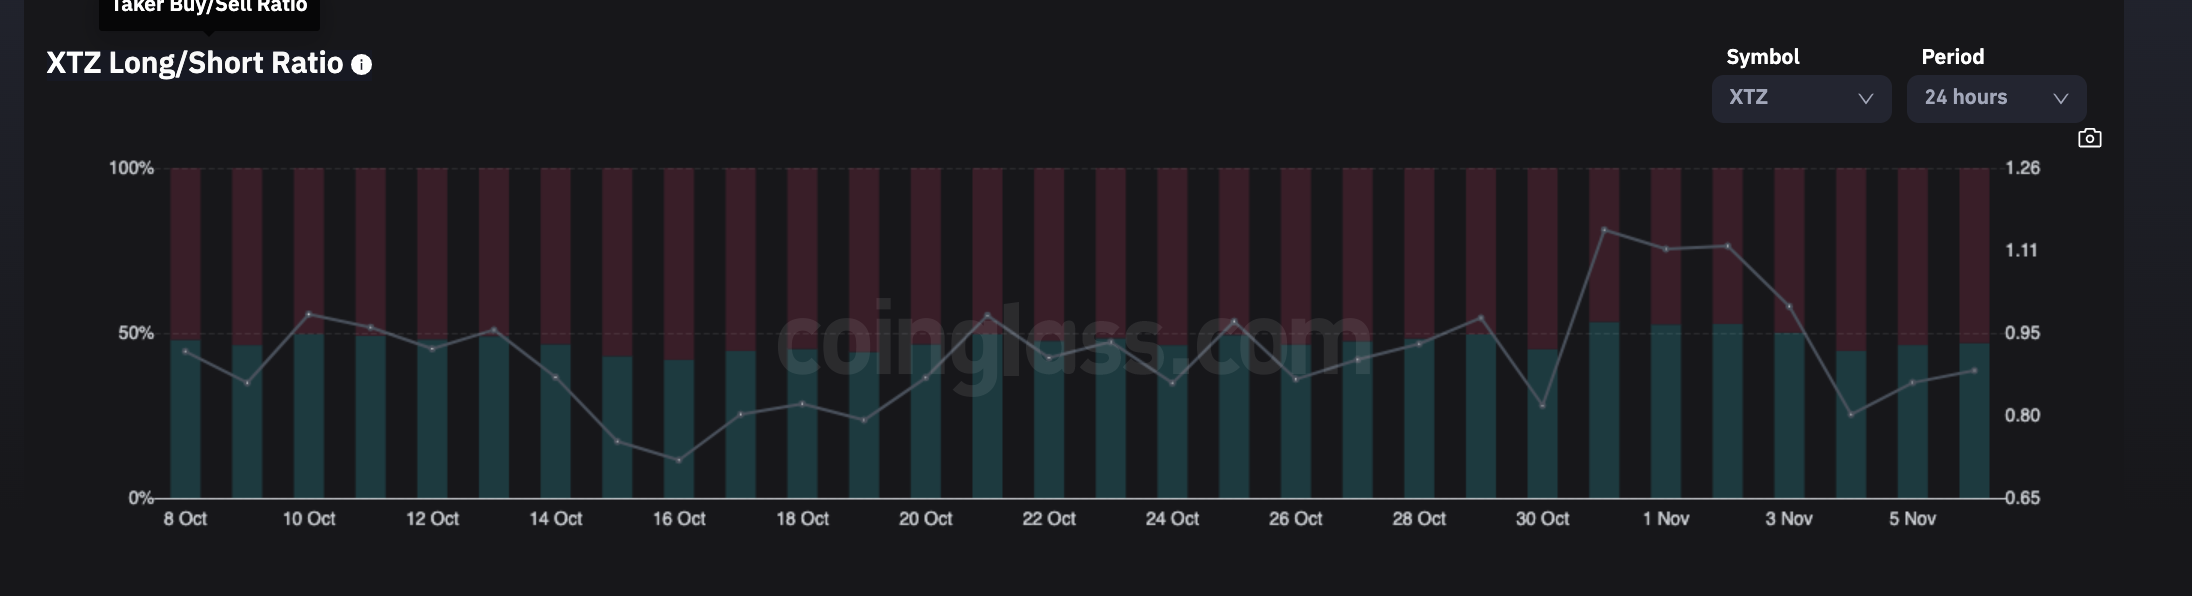
Coinglass's Long vs.Short Indicator
Invalidation of the bearish thesis is a surpass of $1.45, based on the on-chain metrics. If the invalidation point is breached, an additional 10% hike could occur, targeting the psychological $1.50 zone.
Author

Tony M.
FXStreet Contributor
Tony Montpeirous began investing in cryptocurrencies in 2017. His trading style incorporates Elliot Wave, Auction Market Theory, Fibonacci and price action as the cornerstone of his technical analysis.


