Top 3 Price Prediction Bitcoin, Ethereum, Ripple: The calm before the storm
- Bitcoin price consolidates above $20,000 as traders question the next move.
- Ethereum price shows strength by finding support at a key level.
- Ripple price coils in a triangular fashion and could promote a profitable opportunity in the coming days.

The crypto market has come into a new consolidation phase. Key levels have been identified to estimate the next directional move.
Bitcoin price at a standstill
Bitcoin price currently trades at $20,417 as the smaller time frames converge, causing a stalemate-like price action. The last 8-hour candle shows the bears successfully establishing a close through the 8-day exponential moving average. Many traders may have opened a long position on BTC upon the first contact with the moving average near $20,200. Thus a fall below $20,200 could trigger another liquidation event.
A Fibonacci retracement tool surrounding the strongest part of the rally last week shows the current trading range as just a 38.2% retracement. If the bulls fail to hold their grounds, the next probable target will be the 61.8% retracement level at $19,900. If the 61.8% Fib level fails, the trend will be in jeopardy, with bearish targets near the $18,900 liquidity zone.
Invalidation of the bearish outlook will be based on a breach above the recent swing highs at $21,085. If the bulls can hurdle the barrier, an additional equal rally to the last week’s could occur. Such a move would result in a 10% hike toward $22,400.
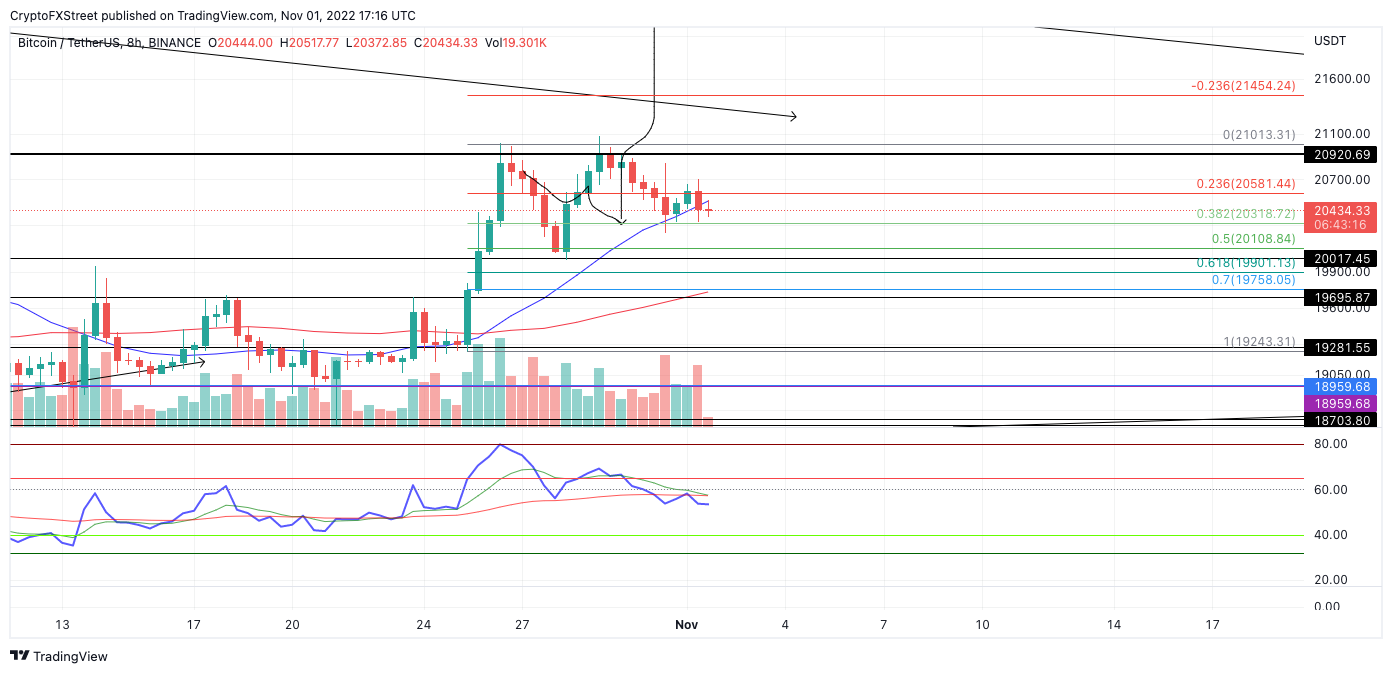
BTC/USDT 8-Hour Chart
In the following video, our analysts deep dive into the price action of Bitcoin, analyzing key levels of interest in the market. -FXStreet Team
Ethereum price is close to a move
Ethereum price consolidates at the upper bounds of the $1,500 level after an impressive 20% rally. The decentralized smart-contract token shows a few optimistic signals hinting that the uptrend will continue. \
Ethereum price currently auctions at $1,573. A Fibonacci tool surrounding the strongest part of last week's rally shows Ethereum has found support from the 38.2% retracement level. The shallow pullback may be viewed as a demonstration of the underlying strength of the bulls during the current move.
If the market is genuinely bullish, a breach above the $1,600 level could catalyze sidelined bulls to enter the market and target the $1,800 liquidity zone for an additional 15% rise.
An Elliot Wave Trend Channel surrounding the beginning stages of the explosive rally compounds the notion that ETH bulls are confidently poised to rally. The stair-stepping price action is higher since ETH's breach of the 38.2% Fib level could be considered a calm-before-the-storm pattern. A powerful influx of bullish price action could enter and resolve the current range.
The uptrend's health depends on lowers Fib levels remaining untagged. A breach of the $1,450 zone could be problematic and induce a selling frenzy. If the bearish scenario occurs, the Ethereum price could be pulled back into the 21-day simple moving average at $1,370. Said price action would result in an 11% decrease from the current Ethereum price.
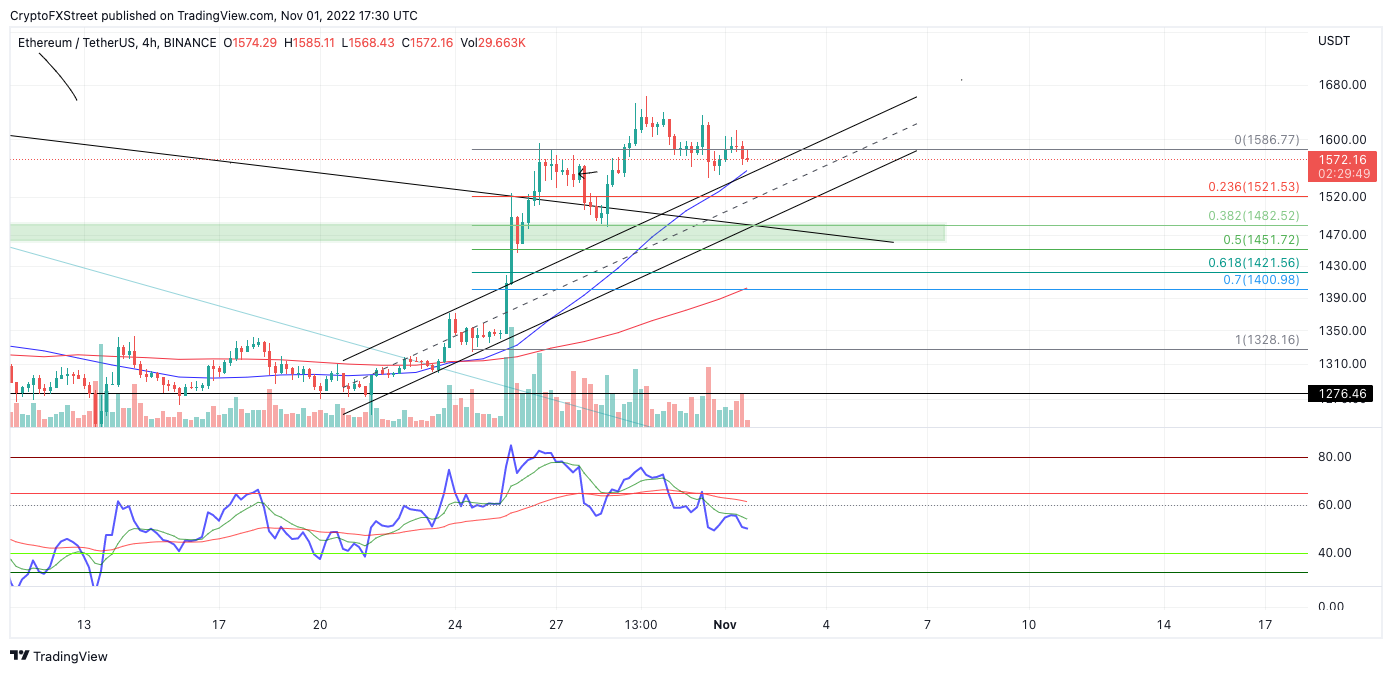
ETH/USDT 4-Hour Chart
In the following video, our analysts deep dive into the price action of Ethereum, analyzing key levels of interest in the market. -FXStreet Team
XRP demonstrates strength
XRP currently auctions at $0.46 as the price has found resistance from both the 8-day exponential and 21-day simple moving averages. As the price hovers below the indicators, a higher low has been established at $0.449. The newfound low could be the final leg of the coiling triangle surrounding the digital remittance token's price since September.
If the market is genuinely bullish, a classic Elliot Wave Triangle Setup should catalyze a run up towards $0.66. A breach of the recent swing high at $0.49 could be the trigger to provoke sidelined bulls.
Invalidation of the bullish thesis targeting $0.56 could occur if the bears sweep the lows at $0.449. If the bears manage to tag this level, a liquidation event targeting October's swing lows at $0.42 seems possible. Such a move would result in a 10% decrease from the current XRP price.
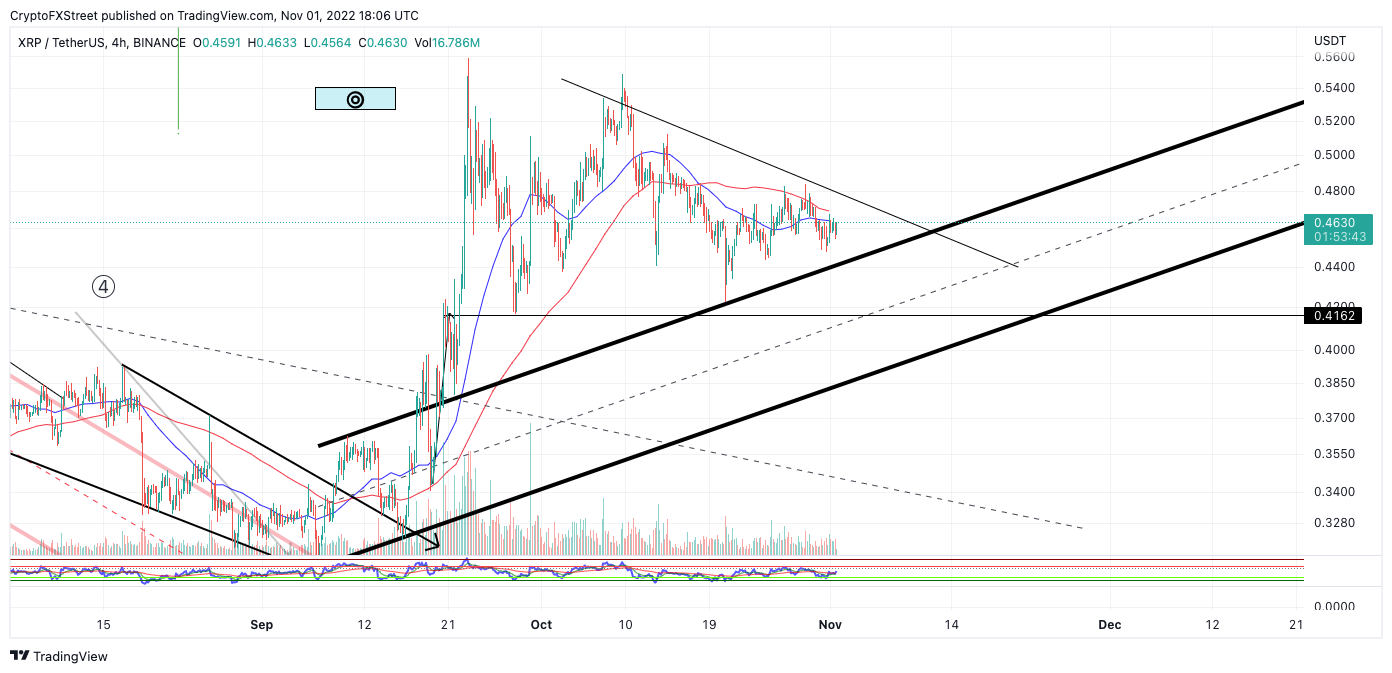
XRP/USD 4-Hour Chart
In the following video, our analysts deep dive into the price action of Ripple, analyzing key levels of interest in the market. -FXStreet Team
Author

Tony M.
FXStreet Contributor
Tony Montpeirous began investing in cryptocurrencies in 2017. His trading style incorporates Elliot Wave, Auction Market Theory, Fibonacci and price action as the cornerstone of his technical analysis.


