Tezos price rebounds from key support, aiming to retest all-time highs


  • Tezos embraces support at the ascending parallel channel lower boundary in preparation for an upsurge to $4.
  • XTZ uptrend is likely to be reinforced by a golden cross pattern on the daily chart.
  • The TD Sequential indicator may present a sell signal on the 12-hour chart, sabotaging the recovery.

Tezos has recovered consistently from Decembers’ dip that saw it revisit $1.6. The uptrend has been taking place within the confines of an ascending parallel channel. A massive breakout is anticipated in the near term, likely to boost XTZ to its all-time highs.

Tezos technicals align in support of a bullish impulse

For more than six weeks XTZ’s price action has been limited by the ascending parallel channel. A recent rejection from the upper edge resulted in a breakdown, retesting the channel’s lower boundary support. At the time of writing, Tezos is trading at $3.1 after a bounce back from the crucial support.

A breakout is anticipated at the middle boundary of the channel, thus placing the $2.4 billion token on a trajectory toward the all-time highs, slightly above $4. Some resistance is also envisaged at $3.5, regardless, Tezos has the potential to continue with the uptrend.

It is worth noting that a golden cross pattern could form on the daily chart. The bullish outlook will manifest when the 50 Simple Moving Average crosses above the longer-term 200 SMA on the daily chart. In other words, the Tezos uptrend is set to get stronger amid the rising trading volume.
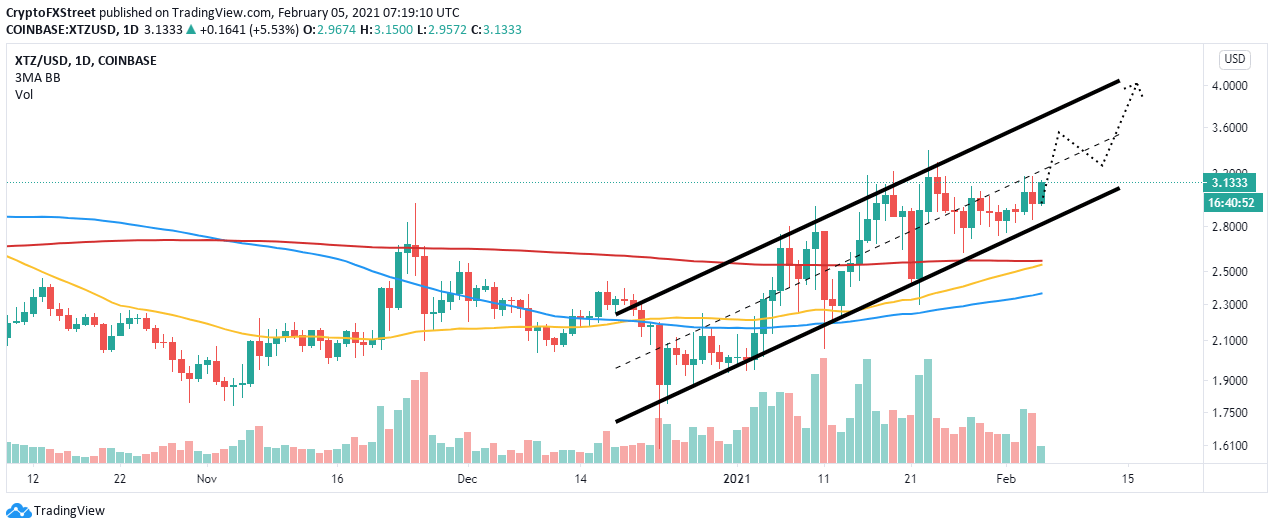
XTZ/USD price chart

XTZ/USD daily chart

Looking at the other side of the fence

The TD Sequential indicator is likely to flash a sell signal on the 12-hour chart in a few hours. Traders utilize this indicator to identify the points where an uptrend or downtrend is exhausted, giving way to a reversal.

A nine green candlestick represents a sell signal and is validated when it closes higher than the 6 and 7 candlesticks. Therefore, a correction may engulf Tezos in the short-term which will sabotage the expected breakout to new all-time highs.

XTZ/USD price chart

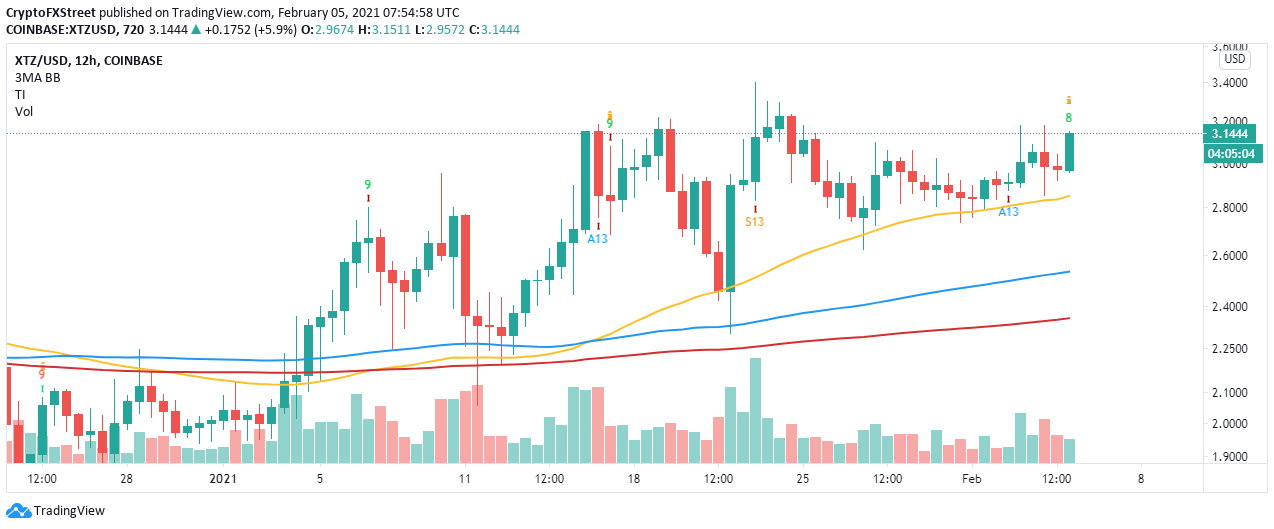
XTZ/USD 4-hour chart

The 12-hour chart highlights the 50 SMA as an initial contact point or immediate support. If declines overshoot this zone, we can expect the 100 SMA and the 200 SMA to come in handy.


Information on these pages contains forward-looking statements that involve risks and uncertainties. Markets and instruments profiled on this page are for informational purposes only and should not in any way come across as a recommendation to buy or sell in these assets. You should do your own thorough research before making any investment decisions. FXStreet does not in any way guarantee that this information is free from mistakes, errors, or material misstatements. It also does not guarantee that this information is of a timely nature. Investing in Open Markets involves a great deal of risk, including the loss of all or a portion of your investment, as well as emotional distress. All risks, losses and costs associated with investing, including total loss of principal, are your responsibility. The views and opinions expressed in this article are those of the authors and do not necessarily reflect the official policy or position of FXStreet nor its advertisers. The author will not be held responsible for information that is found at the end of links posted on this page.

If not otherwise explicitly mentioned in the body of the article, at the time of writing, the author has no position in any stock mentioned in this article and no business relationship with any company mentioned. The author has not received compensation for writing this article, other than from FXStreet.

FXStreet and the author do not provide personalized recommendations. The author makes no representations as to the accuracy, completeness, or suitability of this information. FXStreet and the author will not be liable for any errors, omissions or any losses, injuries or damages arising from this information and its display or use. Errors and omissions excepted.

The author and FXStreet are not registered investment advisors and nothing in this article is intended to be investment advice.

Join Telegram

Recommended content


Recommended Content

Editors’ Picks

Coinbase lists WIF perpetual futures contract as it unveils plans for Aevo, Ethena, and Etherfi

Coinbase lists WIF perpetual futures contract as it unveils plans for Aevo, Ethena, and Etherfi

Dogwifhat perpetual futures began trading on Coinbase International Exchange and Coinbase Advanced on Thursday. However, the futures contract failed to trigger a rally for the popular meme coin.

More Cryptocurrencies News

Stripe looks to bring back crypto payments as stablecoin market cap hits all-time high

Stripe looks to bring back crypto payments as stablecoin market cap hits all-time high

Stripe announced on Thursday that it would add support for USDC stablecoin, as the stablecoin market exploded in March, according to reports by Cryptocompare.

More Cryptocurrencies News

Ethereum cancels rally expectations as Consensys sues SEC over ETH security status

Ethereum cancels rally expectations as Consensys sues SEC over ETH security status

Ethereum (ETH) appears to have returned to its consolidating move on Thursday, canceling rally expectations. This comes after Consensys filed a lawsuit against the Securities & Exchange Commission (SEC) and insider sources informing Reuters of the unlikelihood of a spot ETH ETF approval in May.

More Ethereum News

FBI cautions against non-KYC Bitcoin and crypto money transmitting services as SEC goes after MetaMask

FBI cautions against non-KYC Bitcoin and crypto money transmitting services as SEC goes after MetaMask

US Federal Bureau of Investigations (FBI) has issued a caution to Bitcoiners and cryptocurrency market enthusiasts, coming on the same day as when the US Securities and Exchange Commission (SEC) is on the receiving end of a lawsuit, with a new player adding to the list of parties calling for the regulator to restrain its hand.

More Cryptocurrencies News

Bitcoin: BTC post-halving rally could be partially priced in Premium

Bitcoin: BTC post-halving rally could be partially priced in

Bitcoin (BTC) price briefly slipped below the $60,000 level for the last three days, attracting buyers in this area as the fourth BTC halving is due in a few hours. Is the halving priced in for Bitcoin? Or will the pioneer crypto note more gains in the coming days? 

Read full analysis

BTC

ETH

XRP