Solana price weakens as bearish signal suggests 13% plunge
- Solana price has printed a toppish signal that suggests a cautious short-term outlook for the token.
- SOL could be vulnerable to a 13% nosedive if it does not discover reliable support.
- The Ethereum killer must stay above $161 in order for the bulls to restore the prevailing uptrend

Solana price has encountered a bearish signal that suggests that SOL may face a retracement before continuing its uptrend. The Ethereum killer may slide 13% toward a critical support trend line at $161 before the bulls plan for a comeback.
Solana price lags behind
Solana price has formed an ascending parallel channel on the 12-hour chart, indicating an overall uptrend. However, a top signal given by the Momentum Reversal Indicator (MRI) has emerged, suggesting that a reversal for SOL is in the offing.
The first line of defense for Solana price is at $187, where the 200 twelve-hour Simple Moving Average (SMA) and 21 twelve-hour SMA coincide. SOL will discover an additional foothold at the 50 twelve-hour SMA at $183.
Further support will emerge at the support line given by the MRI at $176 before Solana price drops lower toward the 78.6% Fibonacci retracement level at $172. If SOL fails to hold above the aforementioned lines of defense, the Ethereum killer could slide lower to reach the lower boundary of the prevailing chart pattern at $161, where the December 11 low sits.
If selling pressure continues to increase and the bears continue to take charge, Solana price could plunge further, tagging the October 10 high at $152.
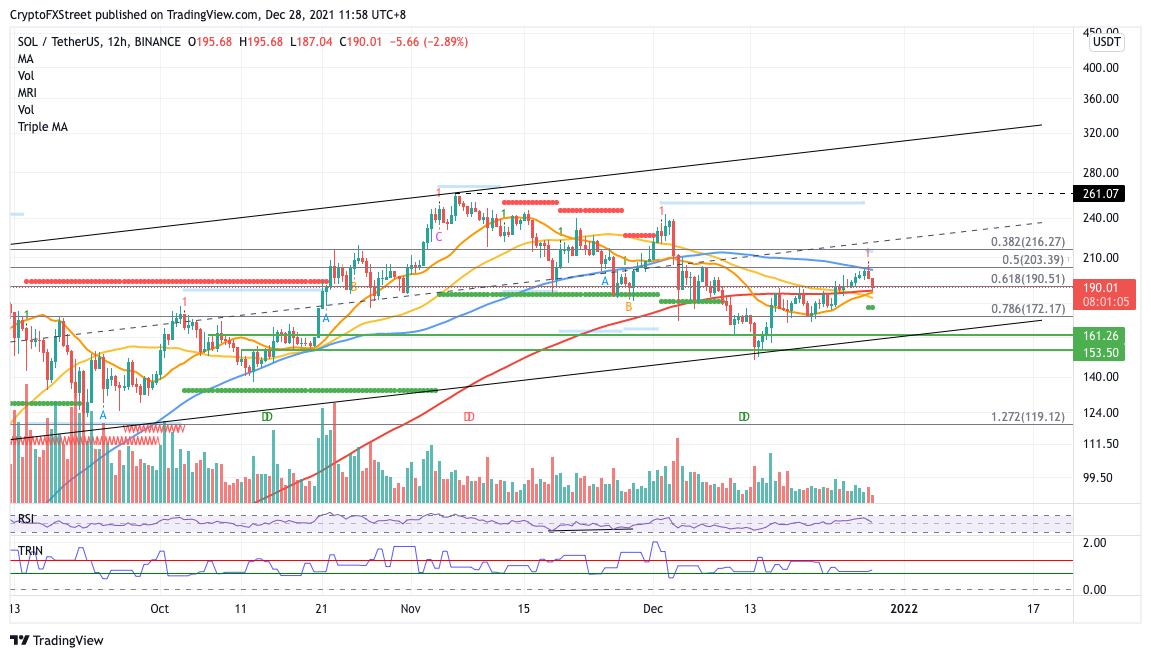
SOL/USDT 12-hour chart
However, if a spike in buy orders occurs, Solana price could tag the 61.8% Fibonacci retracement level at $190, then the 100 twelve-hour SMA at $203, intersecting with the 50% retracement level.
If Solana price manages to surge above the aforementioned level, SOL may be out of the woods and the token could target the middle boundary of the governing technical pattern at $222 but not before facing an obstacle at the 38.2% Fibonacci retracement level at $216.
Author

Sarah Tran
Independent Analyst
Sarah has closely followed the growth of blockchain technology and its adoption since 2016.


