- Solana price is preparing for a quick reversal as it approaches the 4-hour demand zone, ranging from $157 to $166.
- A bounce from this area will lead to a retest of $188 and, in a bullish case, $200.
- If SOL produces a 4-hour swing low below $153, it will invalidate the bullish thesis.
Solana price has been consolidating after its recent uptick in buying pressure. The run-up that followed formed equal highs, leaving quite a bit of liquidity resting above it. Hence, investors can expect market makers to push SOL higher and collect the untapped buy-stops.
Solana price eyes higher high
Solana price is approaching a demand zone, extending from $157 to $166 after setting equal highs at $188. The double top formed on December 18 is a result of the 27% upswing that started on December 13.
Since this upswing, SOL price has been on a retracement and is likely to find support as it dips into the said demand zone, which also harbors the December 4 swing low at $163. A bounce from either of the two barriers is likely to kick-start an ascent to collect liquidity resting above $188.
This run-up could extend beyond this hurdle and make way for the next hurdle at $196, representing an 18% gain. If the bullish momentum persists and Solana price flips this resistance barrier into a support floor, there is a chance SOL might wick above the $204 barrier to collect liquidity resting above another equal high.
In total, SOL has an opportunity to rally 22% from the said demand zone.
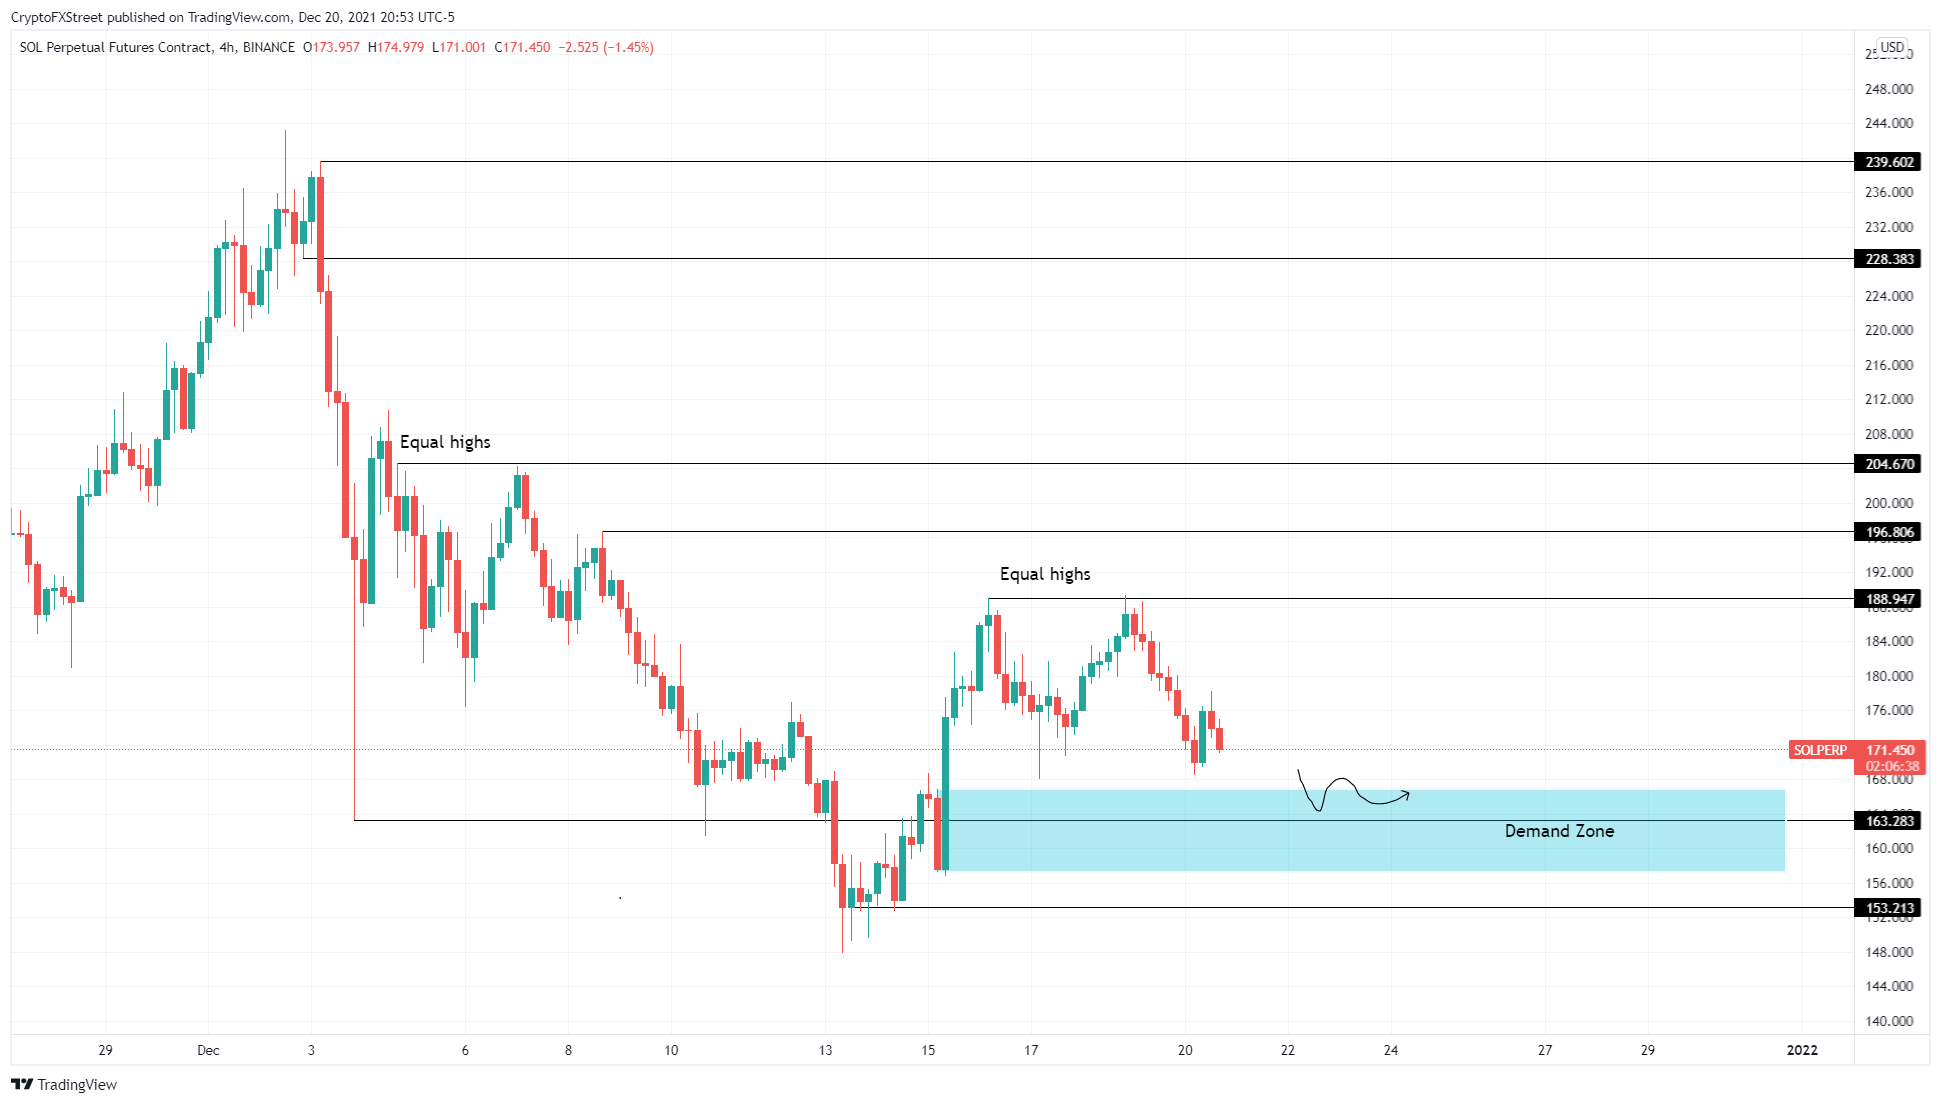
SOL/USDT 4-hour chart
While things are looking up for Solana price, failing to stay above the demand zone, extending from $157 to $166, will indicate increased selling pressure or weak bullish momentum. Either way, a breakdown of this area will lead SOL down to test the $153 platform.
A 4-hour candlestick close below this level will create a lower low, invalidating the bullish thesis for Solana price. This development could lead to a retest of the $147 support level.
Information on these pages contains forward-looking statements that involve risks and uncertainties. Markets and instruments profiled on this page are for informational purposes only and should not in any way come across as a recommendation to buy or sell in these assets. You should do your own thorough research before making any investment decisions. FXStreet does not in any way guarantee that this information is free from mistakes, errors, or material misstatements. It also does not guarantee that this information is of a timely nature. Investing in Open Markets involves a great deal of risk, including the loss of all or a portion of your investment, as well as emotional distress. All risks, losses and costs associated with investing, including total loss of principal, are your responsibility. The views and opinions expressed in this article are those of the authors and do not necessarily reflect the official policy or position of FXStreet nor its advertisers. The author will not be held responsible for information that is found at the end of links posted on this page.
If not otherwise explicitly mentioned in the body of the article, at the time of writing, the author has no position in any stock mentioned in this article and no business relationship with any company mentioned. The author has not received compensation for writing this article, other than from FXStreet.
FXStreet and the author do not provide personalized recommendations. The author makes no representations as to the accuracy, completeness, or suitability of this information. FXStreet and the author will not be liable for any errors, omissions or any losses, injuries or damages arising from this information and its display or use. Errors and omissions excepted.
The author and FXStreet are not registered investment advisors and nothing in this article is intended to be investment advice.
Recommended Content
Editors’ Picks
Ripple's move above this key level could trigger nearly 50% rally for XRP
Ripple has overcome a critical resistance level and flipped into a support floor on the weekly time frame. This development happened while XRP tightly consolidated for roughly 250 days. Investors can expect XRP to kickstart a massive rally.
Optimism price outlook with nearly $90 million worth of OP tokens flooding markets on Friday
Optimism volatility has shrunk in the ours leading to the network’s cliff unlock. It joins the likes of dYdX and Sui, which have similar events on their calendars. As token unlocks are often considered bearish catalysts, investors should brace for a reaction after the event.
Top 3 Price Prediction Bitcoin, Ethereum, Ripple: Retail watches from the sidelines with a bias for shorts
Bitcoin could clear $73,777 peak as BTC bulls resurface. Ethereum might fall 10% before next leg up as ETH RSI teases with sell signal. XRP could lose $0.6000 threshold as Ripple bulls fail to show up.
Jito price could hit $6 as JTO coils up inside this bullish pattern
Jito price action shows a potential cup and handle formation. Based on theoretical measurement rules, a successful breakout could yield a 56% rally to $6.0. A breakdown of the $3.86 support level would create a lower low for JTO and invalidate the bullish thesis.
Bitcoin: BTC may have recovered, but is it out of the woods?
Bitcoin’s (BTC) upward momentum has shown a significant decline for the past two weeks or so. This development led to a bearish signal on the weekly and an uncertain outlook on the monthly.