Solana price on trajectory towards 27% of gains by the end of this weekend
- Solana price makes a technical play as it touches support at the monthly S1 pivot.
- SOL sees bulls entering a window of opportunity for a rally going into the weekend.
- With not much resistance in the way, gains could be as much as 27%.

Solana price (SOL) has hurt some bears’ positions after a false break and beartrap on the orange ascending trend line at $155. This was followed by a break above the monthly S1 support level at $170, a retest yesterday for support and an opening higher this morning. From here, bears will be forced to close out, even more, their short positions as losses start to mount. Expect more bulls to join today as remaining headwinds start to fade by the end of the weekend, permitting a rally in SOL price that could hold 27% of gains by the end of Sunday.
Solana price action could hit $220 by next week
Solana price sees bulls dictating price action in a textbook technical play. With the false break of the orange ascending trend line, bears got lured into a bear trap, followed by a bullish bounce back above the monthly S1 support level at $170. As bulls reached $180 on that same day, some profit-taking occurred, and SOL price action faded slightly back towards the S1 support level. Bulls jumped on that technical entry and with the higher opening today, Solana looks set for another leg up to $200.
Along the way there is not much resistance to face, except for the 55-day Simple Moving Average (SMA) at $209. That level triggered some profit-taking in the past and provided support in the current downtrend, whereas the 200-day SMA and the orange ascending trend line are the backbones of the overall longer-term uptrend. If bulls can punch through that 55-day SMA, expect a similar play from the historical technical level at $220.
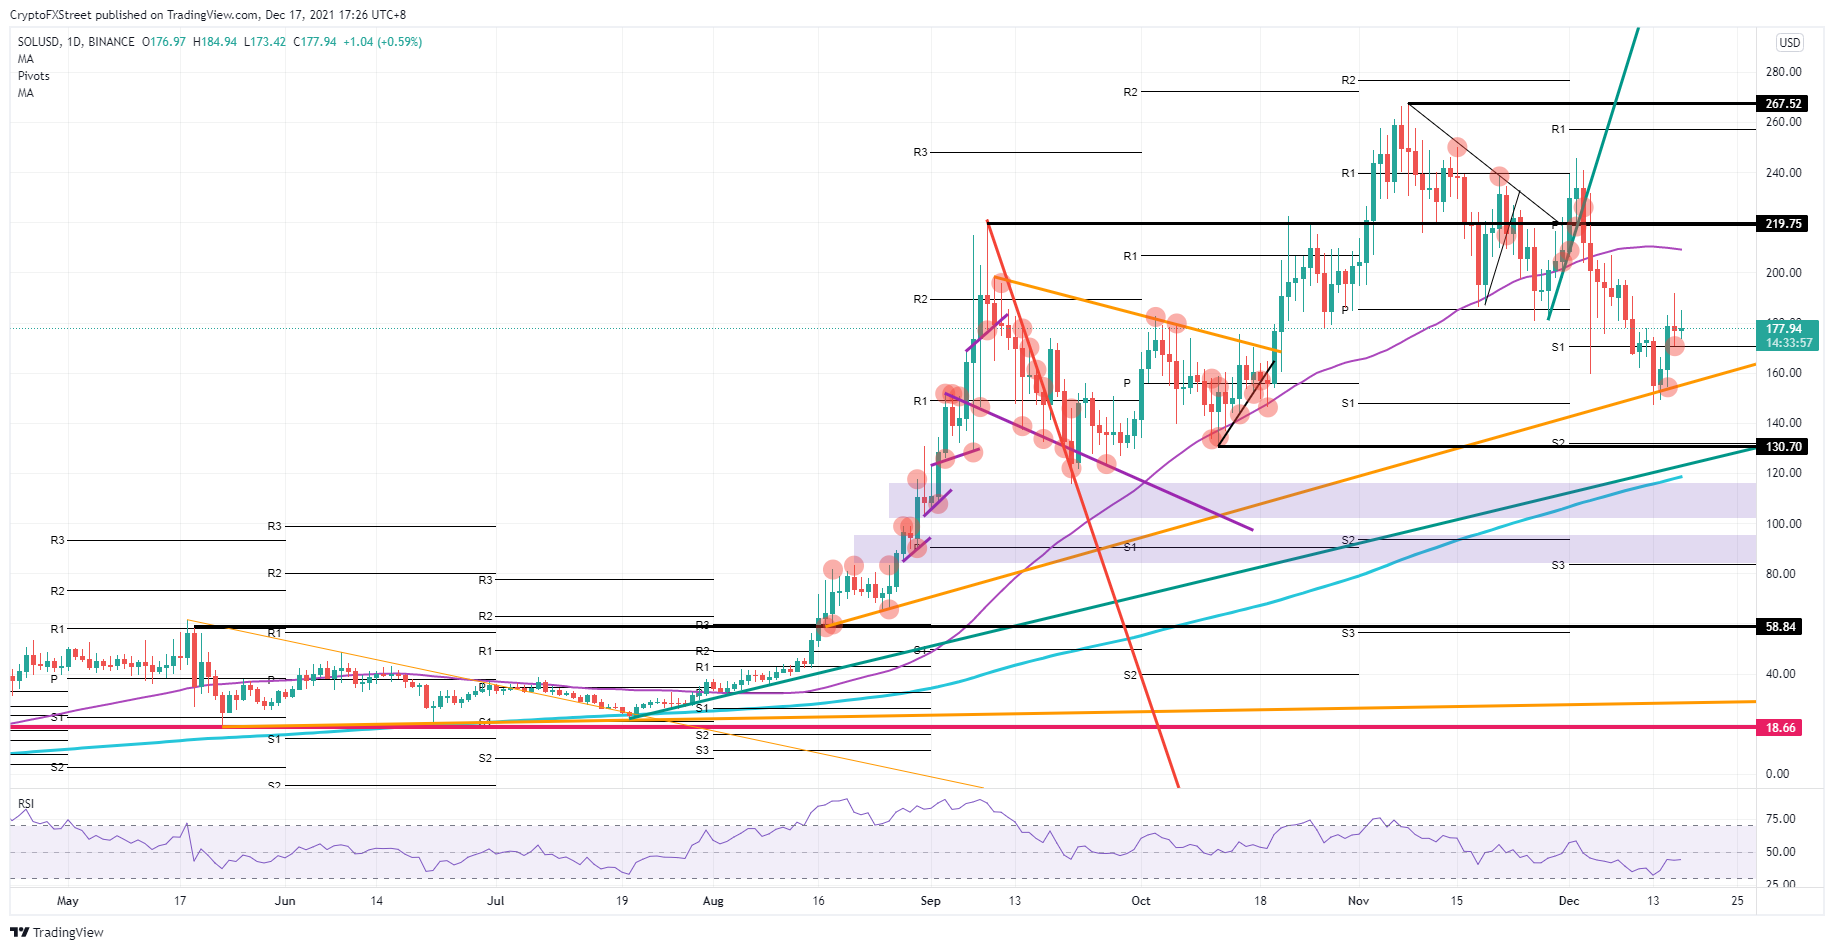
SOL/USD daily chart
Bulls could still face some issues with the current headwinds in global markets. Should SOL price not match and break above the previous high of yesterday, expect a fade back down towards the S1 support level. That could make bears smell blood and go in for a push back below the S1 and a retest and break of the orange ascending trend line, followed by a drop towards $131 where the S2 support level and a historical technical level reside.
Author

Filip Lagaart
FXStreet
Filip Lagaart is a former sales/trader with over 15 years of financial markets expertise under its belt.



