Solana price targets $261 next as bullish pattern projects 27% upswing
- Solana price is ready to reverse the period of underperformance and revisit its record high.
- The prevailing bullish chart pattern suggests a 27% climb from a crucial line of resistance.
- SOL slicing below $170 could spell trouble for the bulls.

Solana price is preparing to revisit its all-time high at $261 as a bullish chart pattern suggests SOL is awaiting a 27% ascent. However, the optimistic target will only be on the radar if the Ethereum killer manages to slice above a critical resistance barrier at $203.
Solana price plans powerful comeback
Solana price has formed an ascending triangle pattern on the 4-hour chart, creating higher lows. If the prevailing chart pattern is robust, SOL could expect a 27% climb from the upper boundary of the governing technical pattern toward $260, the token’s record high.
The first line of resistance appears at the 21 four-hour Simple Moving Average (SMA) at $174, coinciding with the 23.6% Fibonacci retracement level. Further headwinds may emerge at $181, where the 50 four-hour SMA and 100 four-hour SMA intersect.
Additional obstacles may emerge at the 200 four-hour SMA at $185, then at the 38.2% Fibonacci retracement level at $190.
If the bulls continue to push prices higher against the distribution of the sellers, Solana price may aim to tag the topside trend line of the governing technical pattern at $203, where the 50% retracement level and resistance line given by the Momentum Reversal Indicator (MRI) also sits.
Investors should note that a slice above the aforementioned headwind at $203 could put the 27% upswing on the radar, an optimistic forecast given by the prevailing chart pattern.
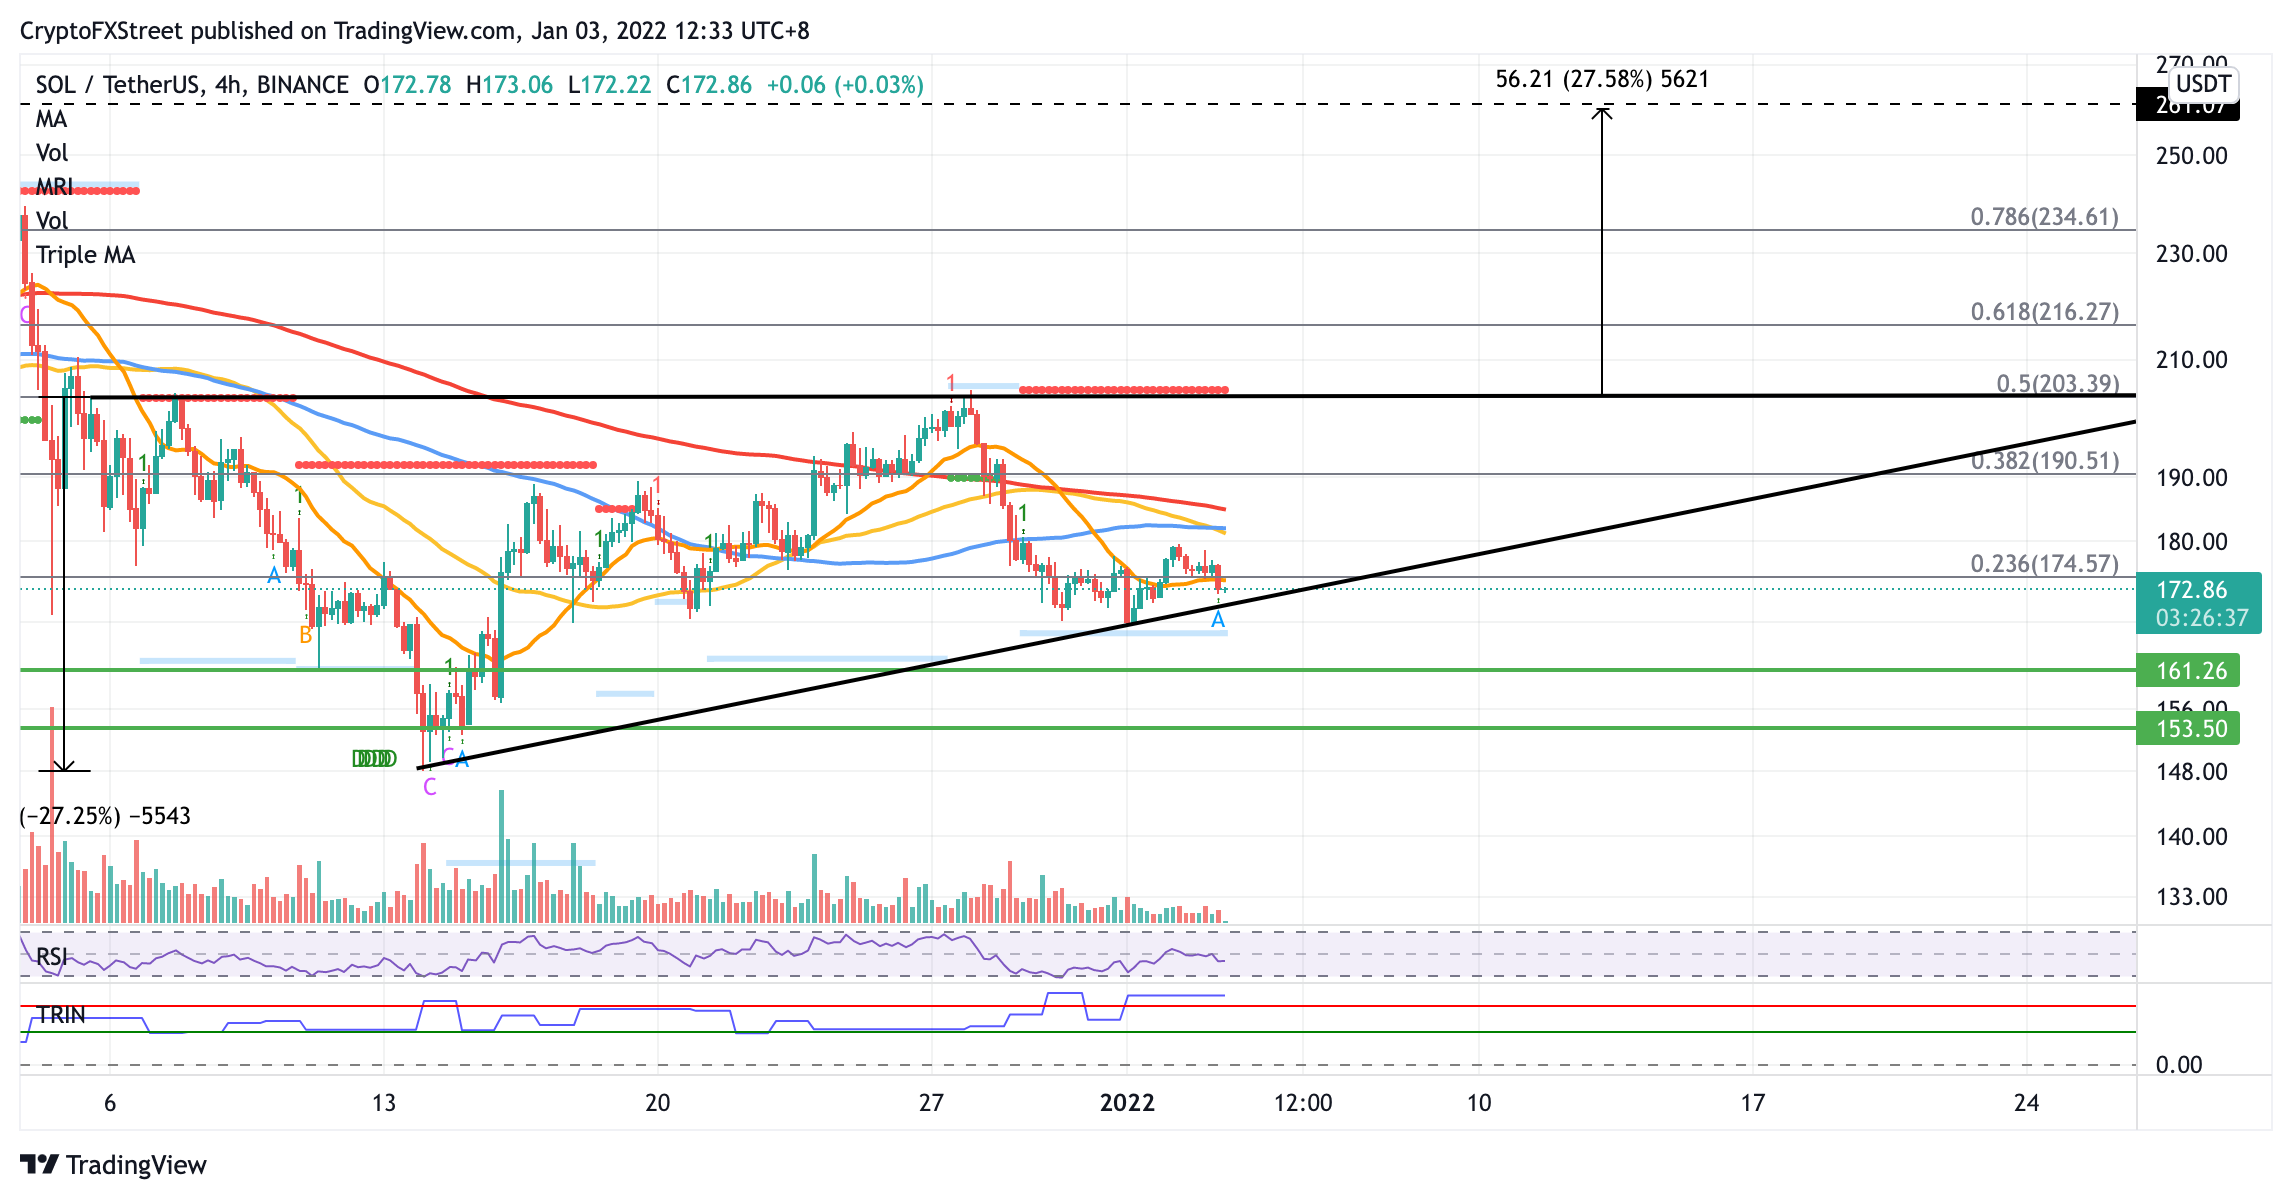
SOL/USDT 4-hour chart
Solana price would face resistance at the 61.8% Fibonacci retracement level at $216 and the 78.6% Fibonacci retracement level at $234 before the bulls attempt to reach the bullish target.
However, if a spike in sell orders occurs, Solana price will discover immediate support at the lower boundary of the governing technical pattern at $170. Breaking below the aforementioned line of defense will invalidate the bullish thesis, and SOL could continue to slide further toward the January 1 low at $167, then toward the October 6 high at $161.
Author

Sarah Tran
Independent Analyst
Sarah has closely followed the growth of blockchain technology and its adoption since 2016.