- Solana price has retracted into a previous fourth wave after printing three sets of impulse waves up.
- SOL price hovers over a parallel channel median line with a tapered volume pattern on the Volume Profile Index.
- SOL price has 90% cushion space to fall without invalidating the macro count.
Despite the ever-looming bearish environment in which the crypto space has found itself, the Solana price shows optimistic macro technicals in the grand scheme of things.
Solana price is macro bullish
Since its inception in May 2020, Solana has rallied immensely from $0.50 to all-time highs at $250. One can easily fit three impulsive waves within the uptrend, which suggests Solana has printed an impulse wave of a larger degree.
Solana price currently auctions at $33.72. Since all-time highs, the SOL price is down 87%, which is the classic level for a market bounce. Additionally, the retracement has fallen into the previous wave four under less volume than the previous bull run. Lastly, the SOL price hovers over the ascending trend channel surrounding the first wave and correction, another text-book-like market-bottom gesture.
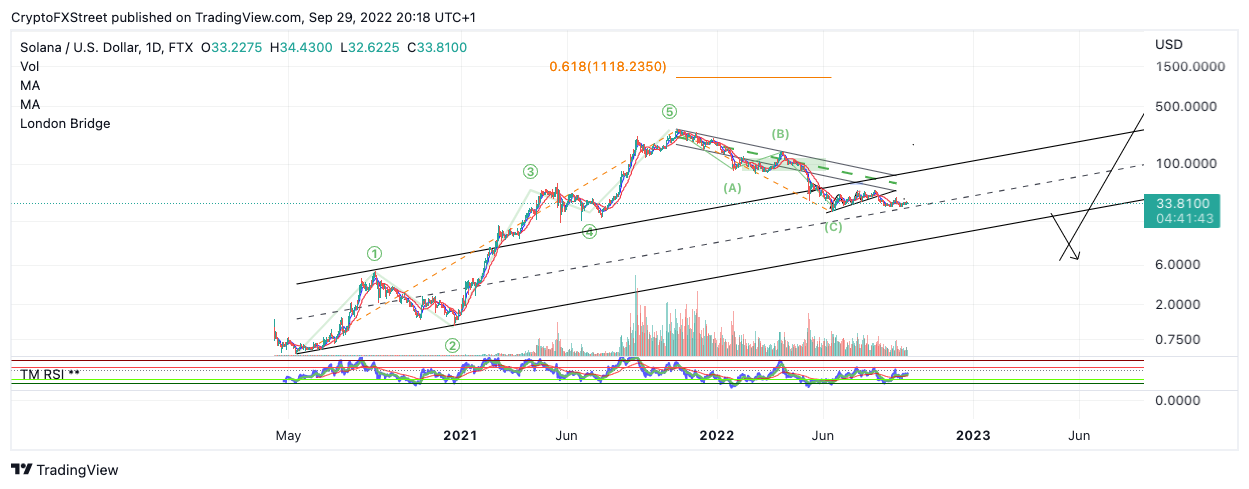
SOL USD 1-Day Chart
A Fibonacci projection tool surrounding the origin and all-time highs, then projected into the current price levels, shows a 61.8% retracement level at $1,118. Based on Elliott Wave and Fibonacci theory, if the Solana price does overcome the bear market, a conventional target to aim for during the next crypto season will be in the $1,000 price level.
Combining these factors, Solana price is a crypto one should confer dollar cost averaging into. The market still has over 90% cushion space to fall without invalidating the macro count. This thesis would be void if the bears were to tag the $0.50 level. Still, several compounding factors suggest SOL will be one of the few cryptos to make it through the bear market.
In the following video, our analysts deep dive into the price action of Solana, analyzing key levels of interest in the market - FXStreet Team
Information on these pages contains forward-looking statements that involve risks and uncertainties. Markets and instruments profiled on this page are for informational purposes only and should not in any way come across as a recommendation to buy or sell in these assets. You should do your own thorough research before making any investment decisions. FXStreet does not in any way guarantee that this information is free from mistakes, errors, or material misstatements. It also does not guarantee that this information is of a timely nature. Investing in Open Markets involves a great deal of risk, including the loss of all or a portion of your investment, as well as emotional distress. All risks, losses and costs associated with investing, including total loss of principal, are your responsibility. The views and opinions expressed in this article are those of the authors and do not necessarily reflect the official policy or position of FXStreet nor its advertisers. The author will not be held responsible for information that is found at the end of links posted on this page.
If not otherwise explicitly mentioned in the body of the article, at the time of writing, the author has no position in any stock mentioned in this article and no business relationship with any company mentioned. The author has not received compensation for writing this article, other than from FXStreet.
FXStreet and the author do not provide personalized recommendations. The author makes no representations as to the accuracy, completeness, or suitability of this information. FXStreet and the author will not be liable for any errors, omissions or any losses, injuries or damages arising from this information and its display or use. Errors and omissions excepted.
The author and FXStreet are not registered investment advisors and nothing in this article is intended to be investment advice.
Recommended Content
Editors’ Picks
Polkadot Price Forecast: DOT confirms trend reversal, eyes retest of $5 after reclaiming key hurdle

Polkadot seems to be ending its downtrend after shedding 92.91% in the last two years from its all-time high of $55.09. In the last three days, DOT has inflated by 3.3%, breaching a declining trendline and confirming the potential start of an uptrend.
Floki Inu Price Forecast: FLOKI sets stage for 30% rally

Floki Inu price rallied nearly 20% on September 30 but closed the candlestick with a 12% gain. The recent uptick opens the possibility of a 30% rally for FLOKI holders. A daily candlestick close below the $0.0000160 level would invalidate the bullish thesis.
Binance Coin Price Prediction: BNB struggles will end after reclaiming $228

Binance Coin (BNB) price has been in a tight consolidation for nearly six weeks. But the range tightening could end soon, potentially allowing bulls to take over and attempt to flip multiple hurdles standing in their way.
Solana Price Forecast: SOL big picture to flip bullish soon, all eyes on $26

Solana (SOL) price seems to be undoing the bearish pressure that has kept it subdued all this time. The recent spike in buying pressure has pushed SOL to produce a higher high on the three-day chart, signaling a shift in momentum favoring bulls.
Bitcoin: BTC recovery rally could be bull trap in disguise, here’s why

Bitcoin (BTC) price remains unfazed even after the multiple spot BTC ETF delays from the US Securities & Exchange Commission (SEC). But investors need to be careful with the ongoing BTC rally as it could be a trap for early bulls.