|

This double scenario for the Solana price could generate a nice profit or a ton of pain

  • Solana price coils within the 8-day exponential and 21-day simple moving averages.
  • SOL price was rejected from a key Fibonacci level.
  • A double scenario is underway, and critical levels have been identified.

Solana is bearing the brunt of the post-US CPI sell-off. Since August, the centralized smart contract token has been on a steep trend. The bulls prompted their first retaliation since September 7, but the CPI announcement on Tuesday has caused a shattering wound to all cryptocurrencies in the ecosystem.

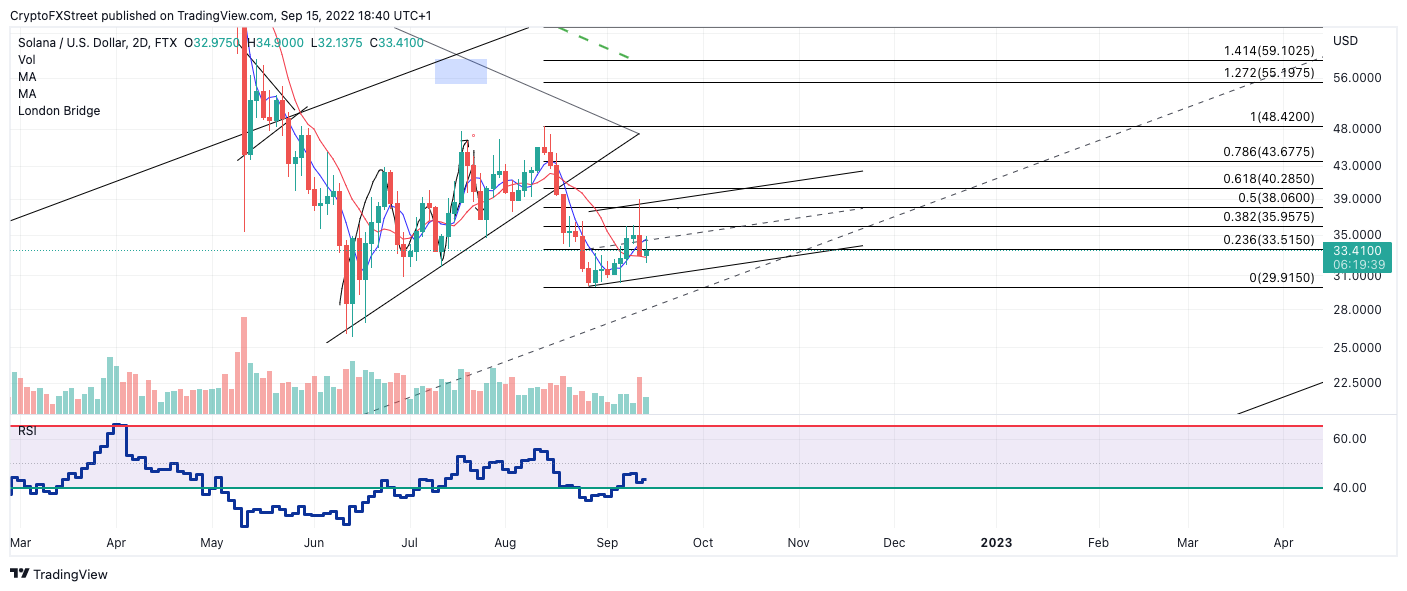
Solana price currently auctions at $33 as the bulls and bears negotiate between the 8-day exponential and 21-day simple moving averages. Compressing the two moving averages around the price is a common occurrence that happens before sharp volatile moves. Traders should be cautious about the direction the Solana price will head next. 
tm/sol/9/15/22

SOL USDT

The directional bias could lean in favor of the bears as a recent 50% Fibonacci level (based on the August high at $48.42 and recent swing low at $29.91) rejected the bulls at the $38 area while printing an uptick in bearish volume.

A breach of the swing at $29.91 could prompt a further decline of equal value to the August downtrend. Such a move would result in a 40% decline.

On the contrary, a daily close above $35 could send SOL price towards the 61.8% Fib level of the mentioned downward move at $40. The bullish move would result in a 20% increase from the current Solana price.

In the following video, our analysts deep dive into the price action of Solana, analyzing key levels of interest in the market - FXStreet Team

Author

Tony M.

Tony M.

FXStreet Contributor

Tony Montpeirous began investing in cryptocurrencies in 2017. His trading style incorporates Elliot Wave, Auction Market Theory, Fibonacci and price action as the cornerstone of his technical analysis.


More from Tony M.
Share:

Editor's Picks

Cardano Price Forecast: Weak momentum puts ADA recovery at risk

Cardano is trading below $0.222 on Thursday after failing to sustain gains above the 50-day Exponential Moving Average near $0.228 the previous day. Weakening derivatives metrics and fading bullish momentum continue to weigh on sentiment, while a break below the 100-day EMA could push ADA lower. Derivatives data shows a cautious outlook for Cardano.

Ripple and Stellar outlook: XRP and XLM recovery stalls below EMAs

Ripple and Stellar remain under pressure on Thursday as both struggle to sustain their recent recovery attempts. XRP trades below $1.36, while XLM slips beneath $0.183, as mixed derivatives metrics, weakening momentum indicators and heating market conditions suggest cautious market sentiment. Derivatives data shows weakening conditions for Ripple and Stellar.

Zcash Price Forecast: ZEC reclaims $1,300 as ETF inflow hits 30-day high

Zcash price hovers above $1,300 on Thursday, sustaining its 15% gains so far this week with three straight days of recovery. Institutional and retail appeal is returning, with over $15 million in inflows recorded on Wednesday and ZEC futures Open Interest rising to a 30-day high of $2.89 billion. The technical outlook for ZEC indicates an upside bias as recovery gains traction.

Bitcoin derivatives improve, but $87,000 sell wall looms
Bitcoin (BTC) showed signs of recovery on Wednesday as derivatives positioning improved, but sell risk grew between $86,500 and $87,500, where sell orders and leveraged liquidation clusters could limit further gains.
Bitcoin: Macroeconomic headwinds, cooling demand cap BTC gains
Bitcoin (BTC) extends losses this week, trading below $82,500 as of Friday as selling pressure continues. Weakening institutional demand supports this pullback as BTC spot Exchange-Traded Funds (ETFs) are on track to record a two-week withdrawal streak, reaching $146.19 million in net outflows through Thursday.