|

Solana price presents day trading opportunities amid a questionable downtrend

  • Solana price has lost 22% of its market value since mid-September.
  • The Volume Profile indicator is still questionable as to who dominates the market.
  • Invalidation of the bullish idea is contingent upon a few factors mentioned below.

Solana price could show a bounce soon. Key levels have been identified.

Solana price is a trader's chart

Solana price has day traders watching the bulls closely, attempting to reclaim grounds with the 8-day exponential moving average. The bullish retaliation comes after Solana's recent 22% decline since mid-September. On larger time frames, the Solana price is stair-stepping into support on the Relative Strength Index. Thus, this is a crucial time for the centralized smart contract token and keeping a close eye is justified.

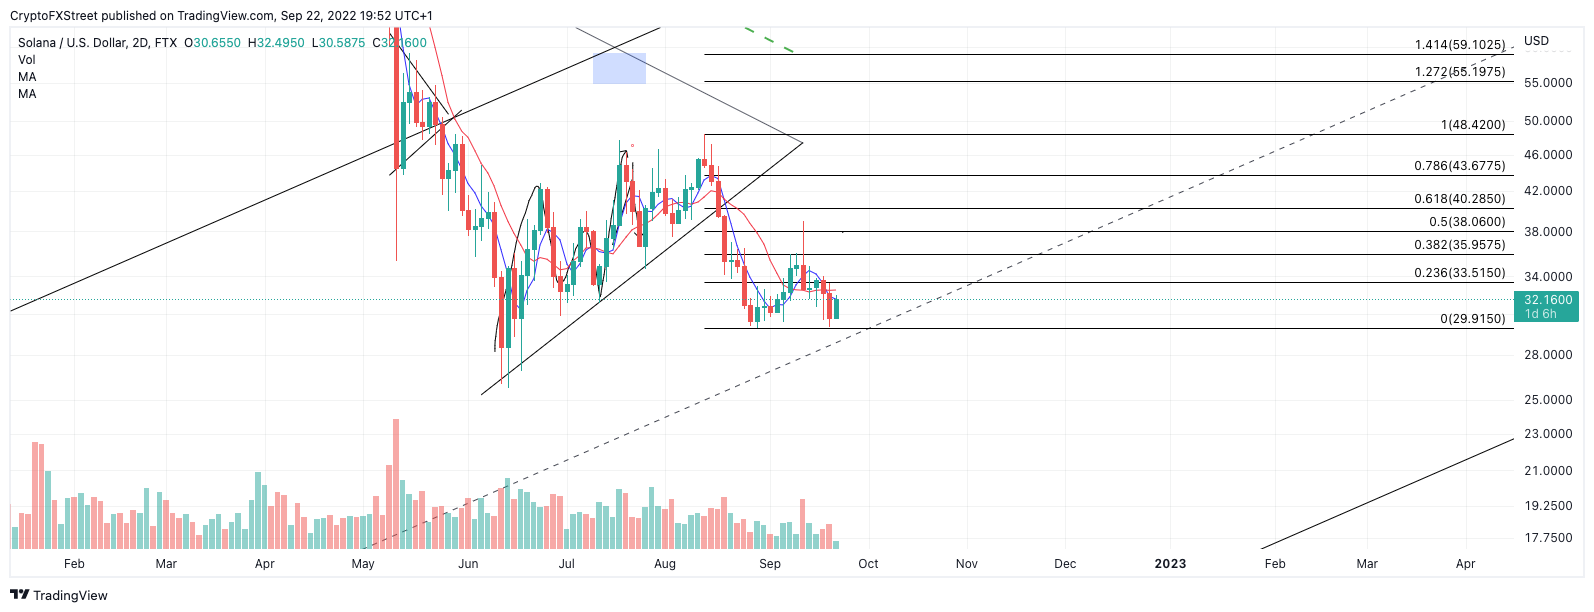
Solana price currently auctions at $32. The downrtrend's power is still up for debate as the Volume Profile Indicator shows a sparse reading. If the bulls can hurdle the 21-day simple moving average at $33.14, then a more confident countertrend trade idea will present itself.

tm/sol/9/22/22

SOL USDT 2-Day Chart

A daily close above $33.14 should give sidelined bulls permission to the 38.2% Fibonacci retracement level (based on the previous swing high to swing low) marked at $35.95.=

Invalidation of the bullish idea is contingent upon the June 14 swing low at $25.75 holding up. If the bears were to breach this level, a further decline targeting a previous congestion zone near $20 could result in a 27% decrease from the current Solana price.

In the following video, our analysts deep dive into the price action of Solana, analyzing key levels of interest in the market - FXStreet Team

Author

Tony M.

Tony M.

FXStreet Contributor

Tony Montpeirous began investing in cryptocurrencies in 2017. His trading style incorporates Elliot Wave, Auction Market Theory, Fibonacci and price action as the cornerstone of his technical analysis.

More from Tony M.
Share:

Editor's Picks

Pepe Price Forecast: PEPE risks 100-day EMA fallout as bullish interest fades

Pepe is under extreme selling pressure, trading in the red for the fifth consecutive day, down 1% at press time on Friday. Pepe’s decline following a 72% hike last week suggests a likely profit-booking phase, while on-chain data indicates declining network activity.

Top 3 Price Prediction: Bitcoin, Ethereum, and Ripple find key support, reviving rally hopes

Bitcoin, Ethereum, and Ripple steadied above key support levels on Friday after being rejected at mid-week resistance zones. The short-term recovery prospects remain intact if the top three cryptocurrencies by market capitalization hold these support zones.

Top Crypto Gainers: JasmyCoin, Polygon, and Monero continue upward trajectory

JasmyCoin, Polygon, and Monero extend gains over the last 24 hours. JasmyCoin struggles to surpass its key psychological resistance, while Polygon and Monero extend their recovery. Still, the technical outlook for these coins remains mixed as the broader cryptocurrency market stalls.

XRP slides as institutional and retail demand falters

Ripple (XRP) is trading down for the third consecutive day on Thursday amid escalating volatility in the cyrptocurrency market. After peaking at $2.41 on Tuesday, its highest print since November 14 amid the early-year rally, XRP has quickly ran into aggressive profit-taking.

Orange Juice Newsletter – Smart insights by real people. Every day.

A free newsletter highlighting key market trends to help traders stay a step ahead. Daily insights on the most relevant trading topics, compiled by our experts in an easy-to-read format so you never miss an important move.

Bitcoin: Fed delivers, yet fails to impress BTC traders

Bitcoin (BTC) continues de trade within the recent consolidation phase, hovering around $92,000 at the time of writing on Friday, as investors digest the Federal Reserve’s (Fed) cautious December rate cut and its implications for risk assets.