- Solana price sees bulls fleeing the scene, as favorable tailwinds from Bitcoin breaking $60,000 do not seem to add further support.
- SOL price is getting squeezed against the ascending trend line, where bulls try to support their uptrend.
- A breakout looks ready to pop above the yellow ascending top line and could see $200 by the end of this week.
Solana (SOL) price attempted to break above the orange descending top line last Friday, helped by the positive spillover effect from Bitcoin, and that is keeping further upside muted in SOL price action.
But the breakout did not materialize and resulted in a bull trap, and now bulls look to scramble to defend the ascending trend line forming a pennant that looks to break either way. With the uptrend and the Relative Strength Index (RSI) nowhere near overbought, expect the breakout still to favor the bulls and further upside in SOL price action.
Solana price sees bulls defending the ascending side of the pennant
Solana price favored the upside and rode along with the Bitcoin rally to break the orange descending top line at $175. But the break turned into a small bull trap and price in SOL faded back below the top line. A short-term ascending trend line has formed a pennant and already withstood three tests to the downside. Expect bulls to still defend this trend line.
By doing so, SOL price will attract more buyers into the price action. With the RSI at 54, buyers have no reason not to add more Solana coins to their portfolio. Expect entries at $157-$158, which will build momentum for a breakthrough in the top line again, with a first target at $180 for short-term profit-taking.
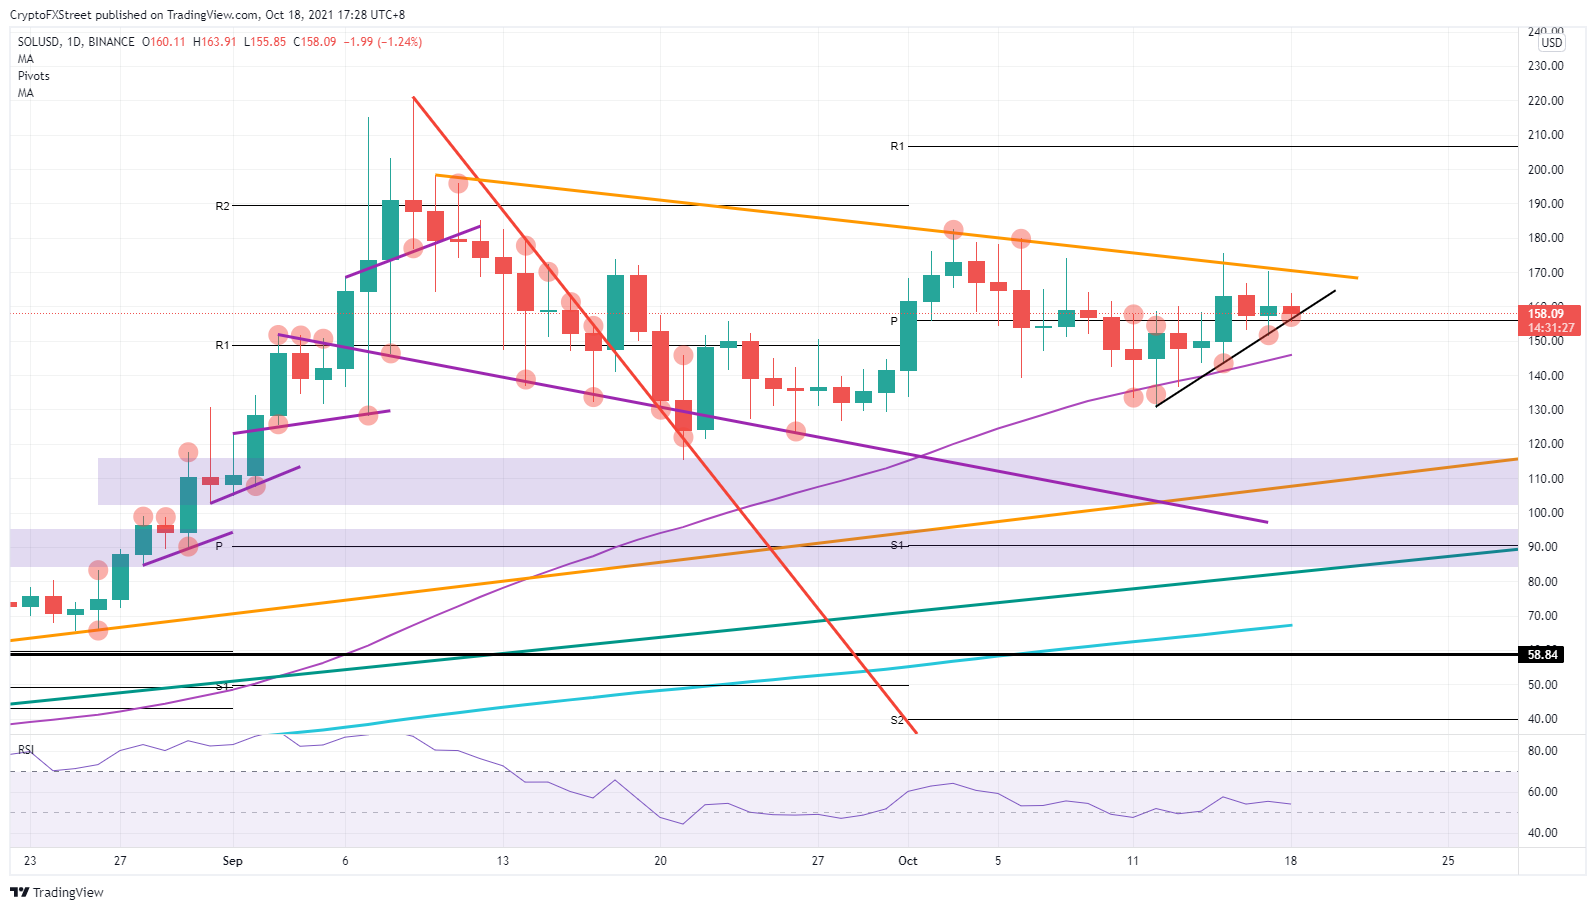
SOL/USD daily chart
SOL price hitting $180 will prove to be a tipping point. If Bitcoin price could be on the route towards new all-time highs, expect some positive spillover effects again on Solana price action, as seen last Friday. Bulls will try to add another 20% in Solana towards $200.
Should the ascending trend line not hold, expect a break lower with the 200-day Simple Moving Average (SMA) to come in at $145. Another leg lower would target $130, with a retest of the low of October. Market sentiment could turn to the downside if Bitcoin started to fade in the wake of new all-time highs.
Information on these pages contains forward-looking statements that involve risks and uncertainties. Markets and instruments profiled on this page are for informational purposes only and should not in any way come across as a recommendation to buy or sell in these assets. You should do your own thorough research before making any investment decisions. FXStreet does not in any way guarantee that this information is free from mistakes, errors, or material misstatements. It also does not guarantee that this information is of a timely nature. Investing in Open Markets involves a great deal of risk, including the loss of all or a portion of your investment, as well as emotional distress. All risks, losses and costs associated with investing, including total loss of principal, are your responsibility. The views and opinions expressed in this article are those of the authors and do not necessarily reflect the official policy or position of FXStreet nor its advertisers. The author will not be held responsible for information that is found at the end of links posted on this page.
If not otherwise explicitly mentioned in the body of the article, at the time of writing, the author has no position in any stock mentioned in this article and no business relationship with any company mentioned. The author has not received compensation for writing this article, other than from FXStreet.
FXStreet and the author do not provide personalized recommendations. The author makes no representations as to the accuracy, completeness, or suitability of this information. FXStreet and the author will not be liable for any errors, omissions or any losses, injuries or damages arising from this information and its display or use. Errors and omissions excepted.
The author and FXStreet are not registered investment advisors and nothing in this article is intended to be investment advice.
Recommended Content
Editors’ Picks
Ripple's move above this key level could trigger nearly 50% rally for XRP
Ripple has overcome a critical resistance level and flipped into a support floor on the weekly time frame. This development happened while XRP tightly consolidated for roughly 250 days. Investors can expect XRP to kickstart a massive rally.
Optimism price outlook with nearly $90 million worth of OP tokens flooding markets on Friday
Optimism volatility has shrunk in the ours leading to the network’s cliff unlock. It joins the likes of dYdX and Sui, which have similar events on their calendars. As token unlocks are often considered bearish catalysts, investors should brace for a reaction after the event.
Top 3 Price Prediction Bitcoin, Ethereum, Ripple: Retail watches from the sidelines with a bias for shorts
Bitcoin could clear $73,777 peak as BTC bulls resurface. Ethereum might fall 10% before next leg up as ETH RSI teases with sell signal. XRP could lose $0.6000 threshold as Ripple bulls fail to show up.
Jito price could hit $6 as JTO coils up inside this bullish pattern
Jito price action shows a potential cup and handle formation. Based on theoretical measurement rules, a successful breakout could yield a 56% rally to $6.0. A breakdown of the $3.86 support level would create a lower low for JTO and invalidate the bullish thesis.
Bitcoin: BTC may have recovered, but is it out of the woods?
Bitcoin’s (BTC) upward momentum has shown a significant decline for the past two weeks or so. This development led to a bearish signal on the weekly and an uncertain outlook on the monthly.