Solana bound for further losses as SOL eyes $125
- Solana price slides below bear flag pattern.
- The Monday daily close below the Tenkan-Sen and Kijun-Sen signals near-term weakness.
- Limited downside risk as strong support exists near the $125 value area.

Solana price has drifted lower ever since hitting the most recent swing high of $177 on October 3rd. There have been several attempts to position Solana into conditions that would create an extremely bullish entry within the Ichimoku system, but all attempts have failed. So instead, Solana has slowly drifted south.
Solana price closes below key Ichimoku support levels, but more substantial support is nearby
Solana price has a considerable number of support levels that are likely to prevent any near-term bearish sentiment. While the close below a bear flag is often a precursor to another round of selling pressure and new near-term lows, the proximity and frequency of support inside a $15 range would give any short-seller pause. These are the support levels that exist between $116 and $125:
1. Weekly Tenkan-Sen ($125).
2. Senkou Span A ($122).
3. Weekly Kijun-Sen ($118).
4. 38.2% Fibonacci retracement ($116).
If bulls fail to hold support within the bounds of the above support levels, then Solana price will almost certainly push to sub $100 levels. A close below Senkou Span near $120 may be enough for bears to take over because the Chikou Span would also be below the candlesticks and in ‘open-space.
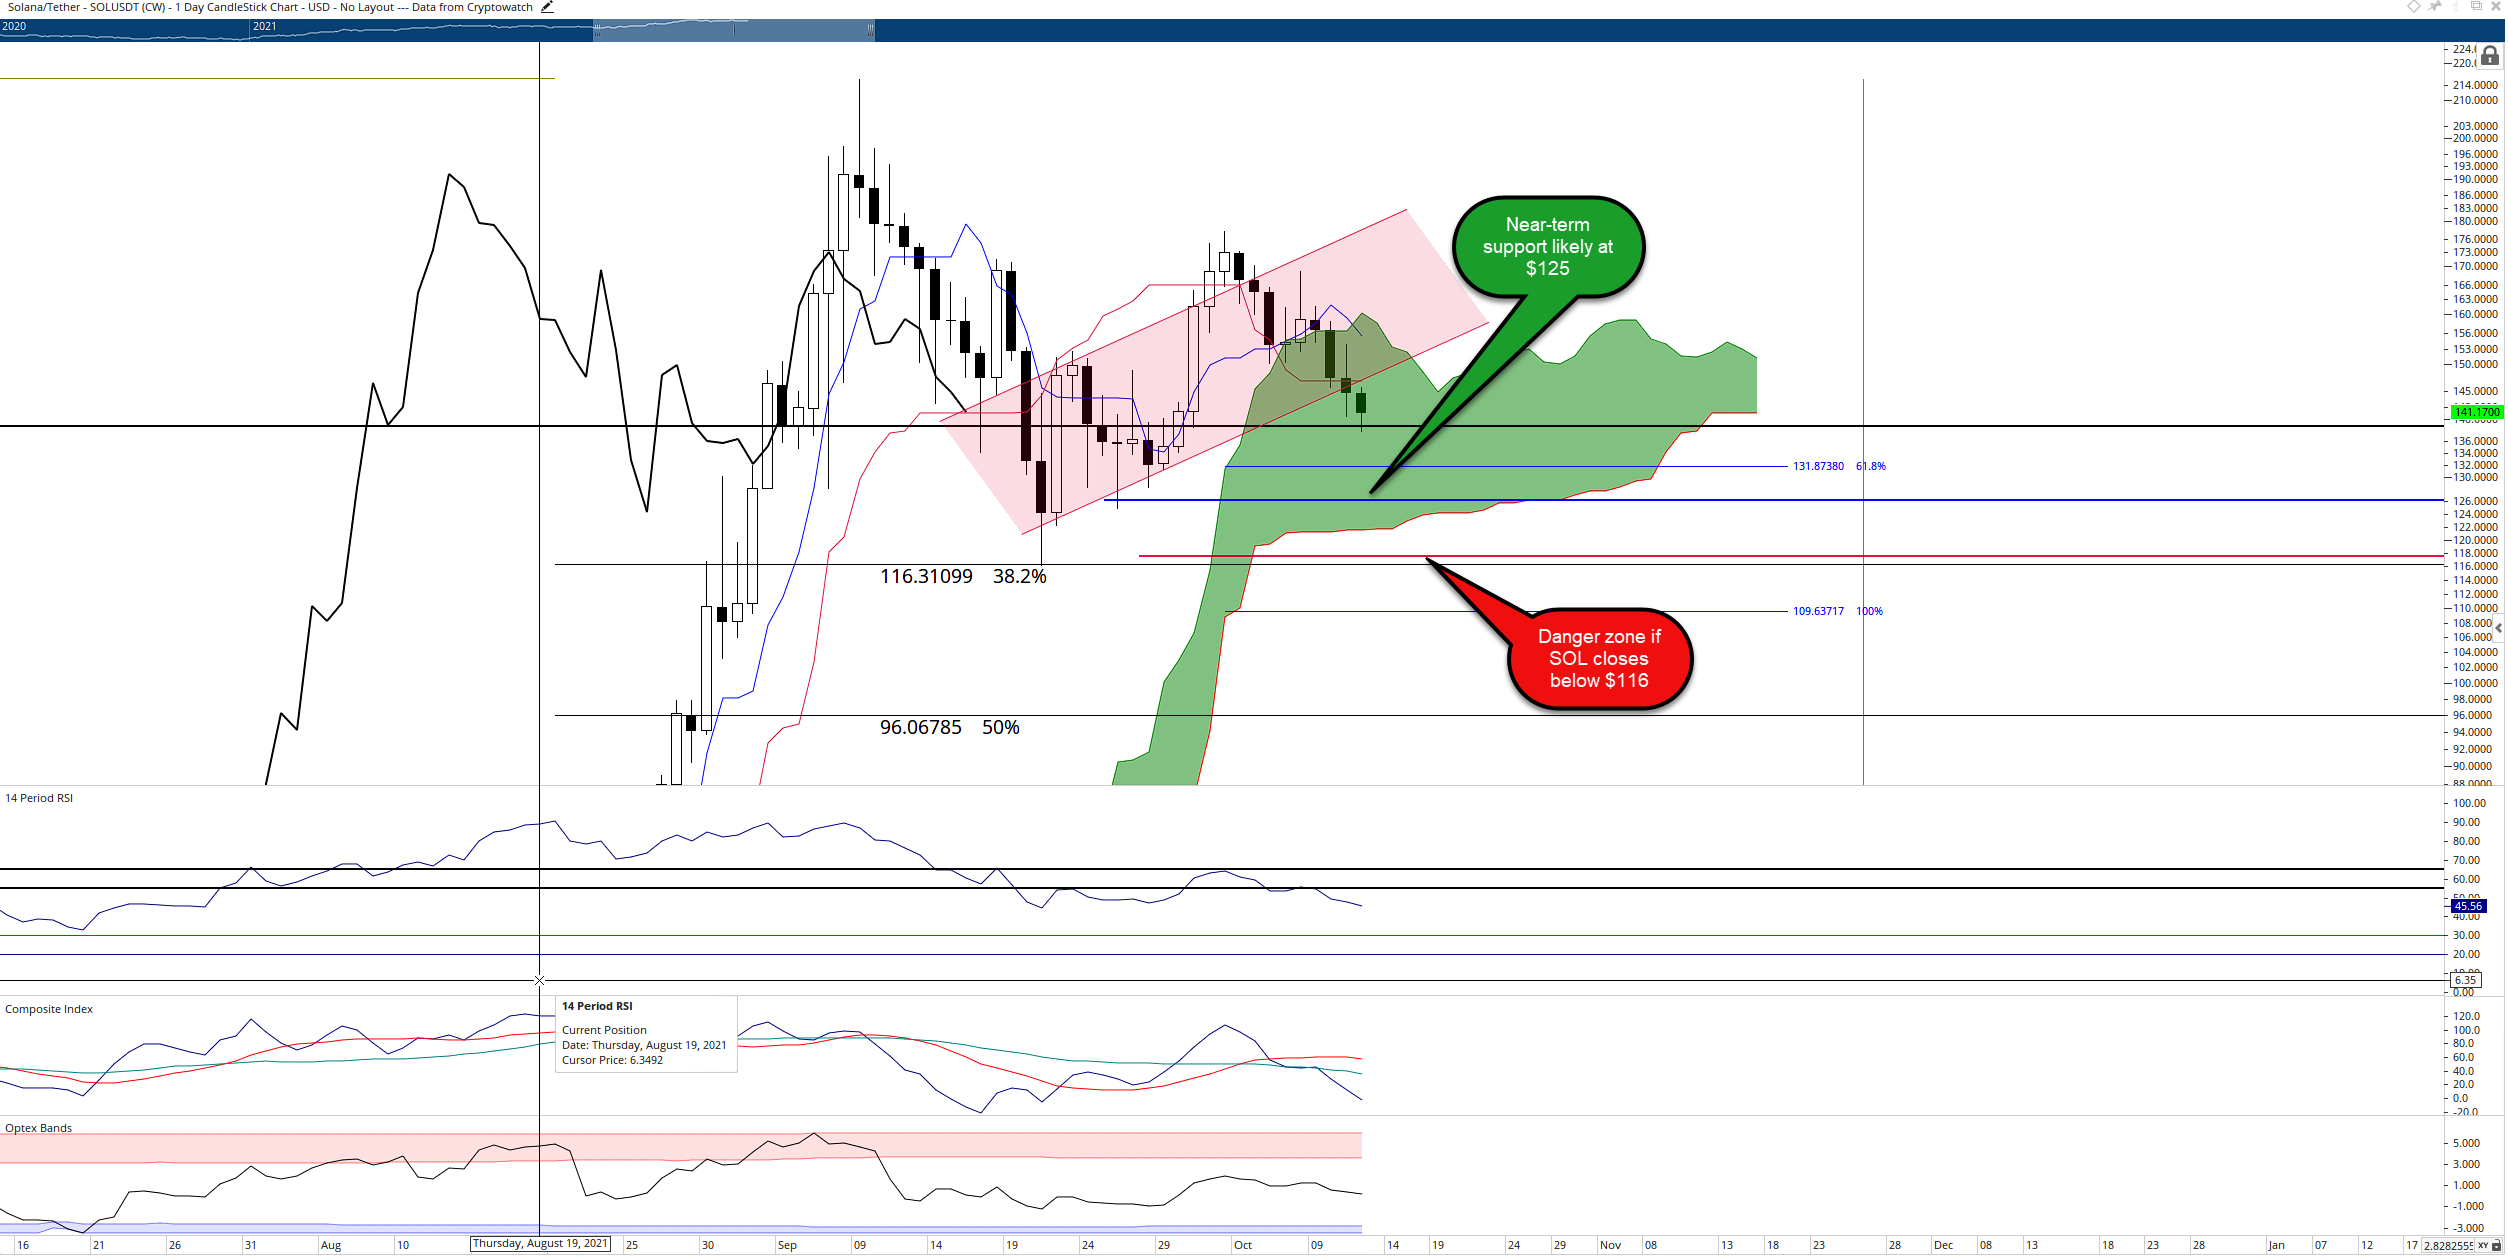
SOL/USDT Daily Ichimoku Chart
Bulls eyeing support near $125 may want to wait for one key piece of technical analysis before entering any new long position. Ideally, Solana price would move between $116 and $125 while the Composite Index creates a low below the September 17th level. This would mean the Composite Index has a lower low while the candlestick chart has a higher low – hidden bullish divergence.
If support is found around $125 and the Composite Index creates hidden bullish divergence, then a breakout above $175 would likely trigger a move towards new all-time highs.
Author

Jonathan Morgan
Independent Analyst
Jonathan has been working as an Independent future, forex, and cryptocurrency trader and analyst for 8 years. He also has been writing for the past 5 years.




