Solana price consolidates, while SOL spells more downside
- Solana price action is being capped on the topside by an orange descending trend line.
- SOL prices are making lower highs and higher lows.
- As price action starts to fade in Solana, a lower break looks to be the outcome of the consolidation toward $105.

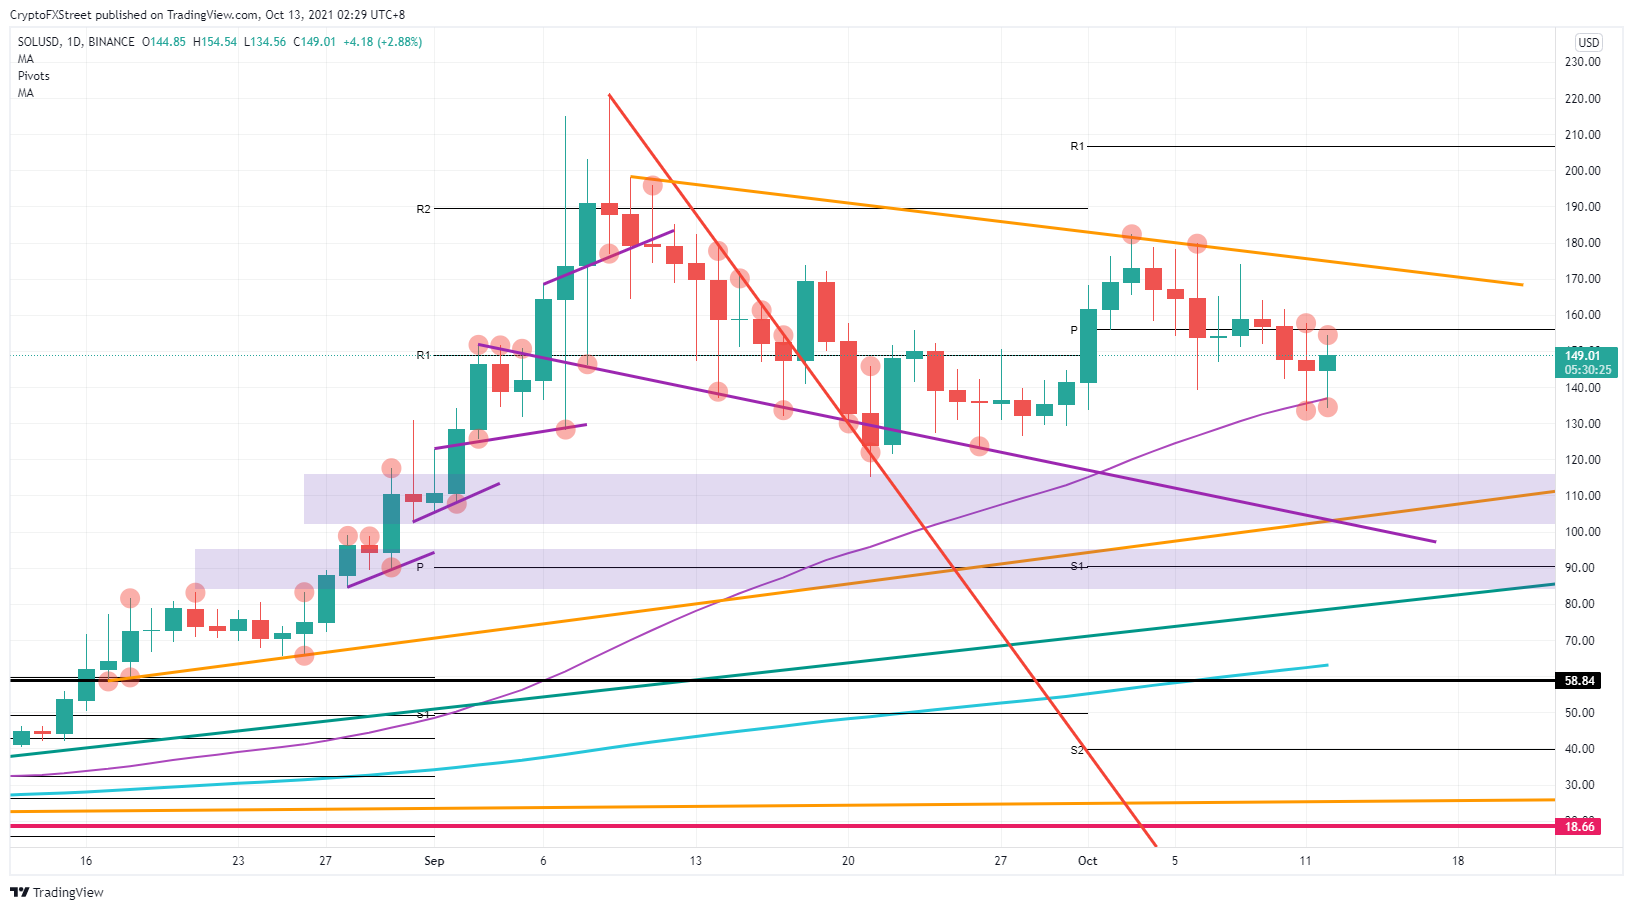
Solana (SOL) price action has been going sideways since the beginning of October and is starting to fade to the downside. On an intraday basis, SOL price action starts to consolidate with lower highs and higher lows. As bulls cannot defend the monthly pivot anymore at $156, expect bears to take the upper hand in Solana price action and dip toward $105.
Solana price sees bulls surrendering and bears gaining speed
Solana price action saw bulls trying to break above $180, but the attempt was short-lived and formed a cap with the orange descending trend line originating from September 10. With price action fading in October, bulls cannot withstand any bearish action and have to forfeit on the monthly pivot at $156.
The SOL price action still has the 55-day Simple Moving Average (SMA) providing support around $136. That support looks weak with only two tests, and both of them were not that clean with some SOL price action falling below the 55-day SMA. Bears look to hold all the cards and could run price action further to the downside.
SOL/USD daily chart
Solana bears will want to go for the first purple zone near $115 and $102. Specifically, the crossing between the purple descending trend line and the orange ascending trend line looks to be an interesting level where bears will undoubtedly look to lock in some profit near $105. A further push lower looks unlikely with the second purple bandwidth and $100 forming a base that bulls will want to defend.
In case market sentiment turns to the upside and provides some favorable tailwinds for SOL price, expect a retest of the orange descending trend line. A break above would unlock more ground to cover for the bulls toward $220.
Author

Filip Lagaart
FXStreet
Filip Lagaart is a former sales/trader with over 15 years of financial markets expertise under its belt.



