Solana bulls set up a bear trap before the breakout to $130
- Solana price undergoes upside rejection on Wednesday, turning into a bull trap.
- SOL price sees bulls making a fist and pushing against the bull trap.
- Expect a big move higher as tailwinds mount for a positive divergence.

Solana (SOL) price saw its winning streak cut short on Wednesday, with bears performing a bull trap after bulls were able to push SOL price briefly above the monthly pivot at $110. Into the US close price collapsed and fell back to $105. Usually, SOL price would tank further after such a technical play, but instead, the bulls are fighting back and are undoing the bull trap and could even replay the same trade against the bears by trying to close back above $110 and the monthly pivot. That would see bearish interest fade and open the door for a rally back up to $130.70.
SOL price set to jump 25% in bear trap squeeze-out
Solana price is almost halfway through its rally, with the bounce-off of $95 triggered on Easter Monday in a quiet market with thin liquidity, as most markets were closed. At the moment, bulls remain sitting on their hands and are letting the rally run, although bears came into the mix on Wednesday with a countermove in the form of a bull trap. Once SOL price popped above $110 and the monthly pivot, bears pushed price action down, catching all the bullish volume in positions that got filled above $110.
SOL price would usually be further on the back foot as bears tried to squeeze out those bulls back to $100 or lower. But instead, bears are being trapped on their turn as SOL is up roughly 2% on the day and set to jump even higher in the coming days with the first target on the docket at $120 and the next $130.70. Additional tailwinds are helping bulls, which will make market liquidity on the buy-side even thinner, giving no room for bears to be able to sell and push price action down (as they will need to offer lower prices than the market to be able to open up a short-position putting them in a disadvantage from the start), which will result in a 25% rally for traders that go long today.
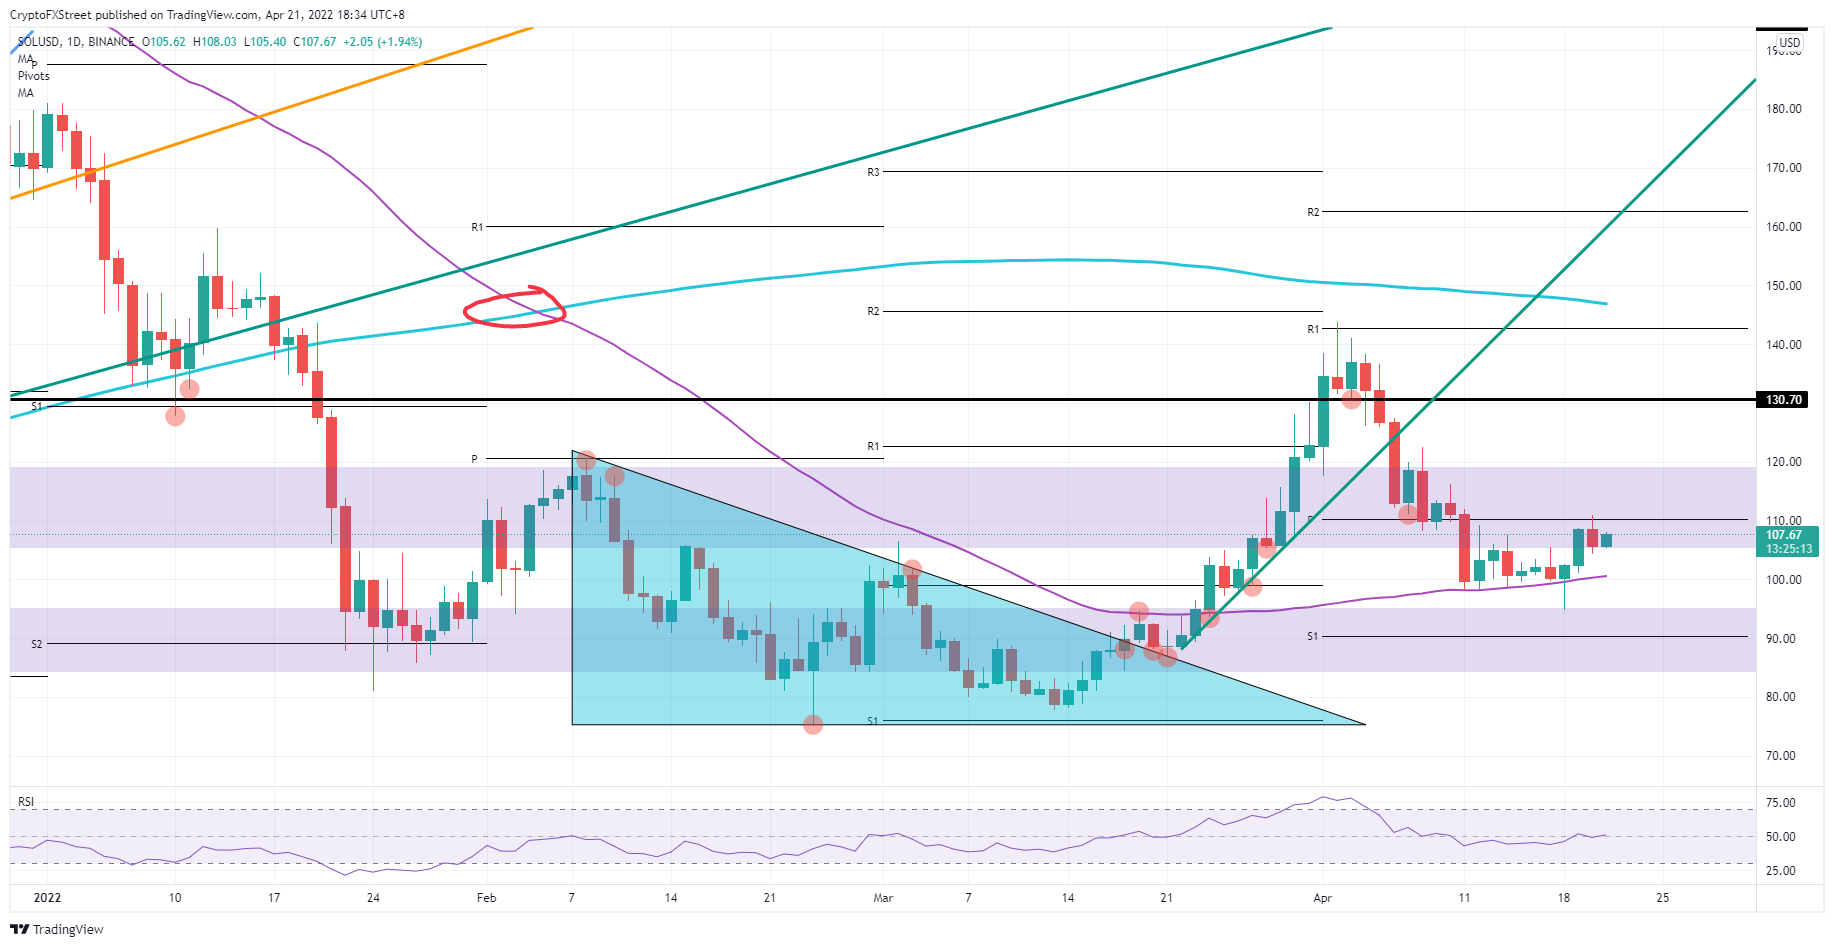
SOL/USD daily chart
Although moving a bit to the background, the situation in Ukraine and Russia is far from resolved. Any event like the use of nuclear weapons or a missile attack on European soil could further escalate and see retaliation by NATO. That would see an instant bid for safe havens and risk assets on the back foot, with SOL price dropping below $100 towards $90 at the monthly S1.
Author

Filip Lagaart
FXStreet
Filip Lagaart is a former sales/trader with over 15 years of financial markets expertise under its belt.



