Can Solana price overcome this hurdle to retest $135
- Solana price reveals a struggle to overcome a crucial hurdle at $101.70.
- Investors can expect SOL to rally 35% and retest the $135 hurdle.
- A daily candlestick close below $80.76 will invalidate the bullish thesis.

Solana price foreshadows an uptrend as it consolidates below a crucial support level. This move could also propel SOL to highs last seen two weeks ago.
Solana price awaits a breakout
Solana price rallied 51% on January 24 and set a range extending from $80.76 to $121.52. Since then SOL has been stuck trading in between the two boundaries. Typically, rangebound moves often sweep one side before turning and making a run to the other side.
SOL price action followed the same pattern after it deviated below the range low on February 20 before beginning an 83% upswing. Although this move set a swing high at $143.56, which was substantially higher than the range high, it failed to sustain.
The bearish market structure combined with investor profit-taking led to a 32% downswing that not only broke back below the range high at $122.64 but also slid under the midpoint at $101.70. Since April 11, Solana price has been stuck trading under this barrier, yet it is consolidating with hopes of moving higher.
A decisive daily candlestick close above $101.70 will indicate a resurgence of buyers and propel SOL by 20% to retest the range high at $121.52. If market makers want additional secondary confirmation they can wait until after the $104.92 barrier has been flipped into a support level before going long.
In a highly bullish case, SOL could extend beyond the range high and revisit the $136.92 level, bringing the sum total run-up to 35%.
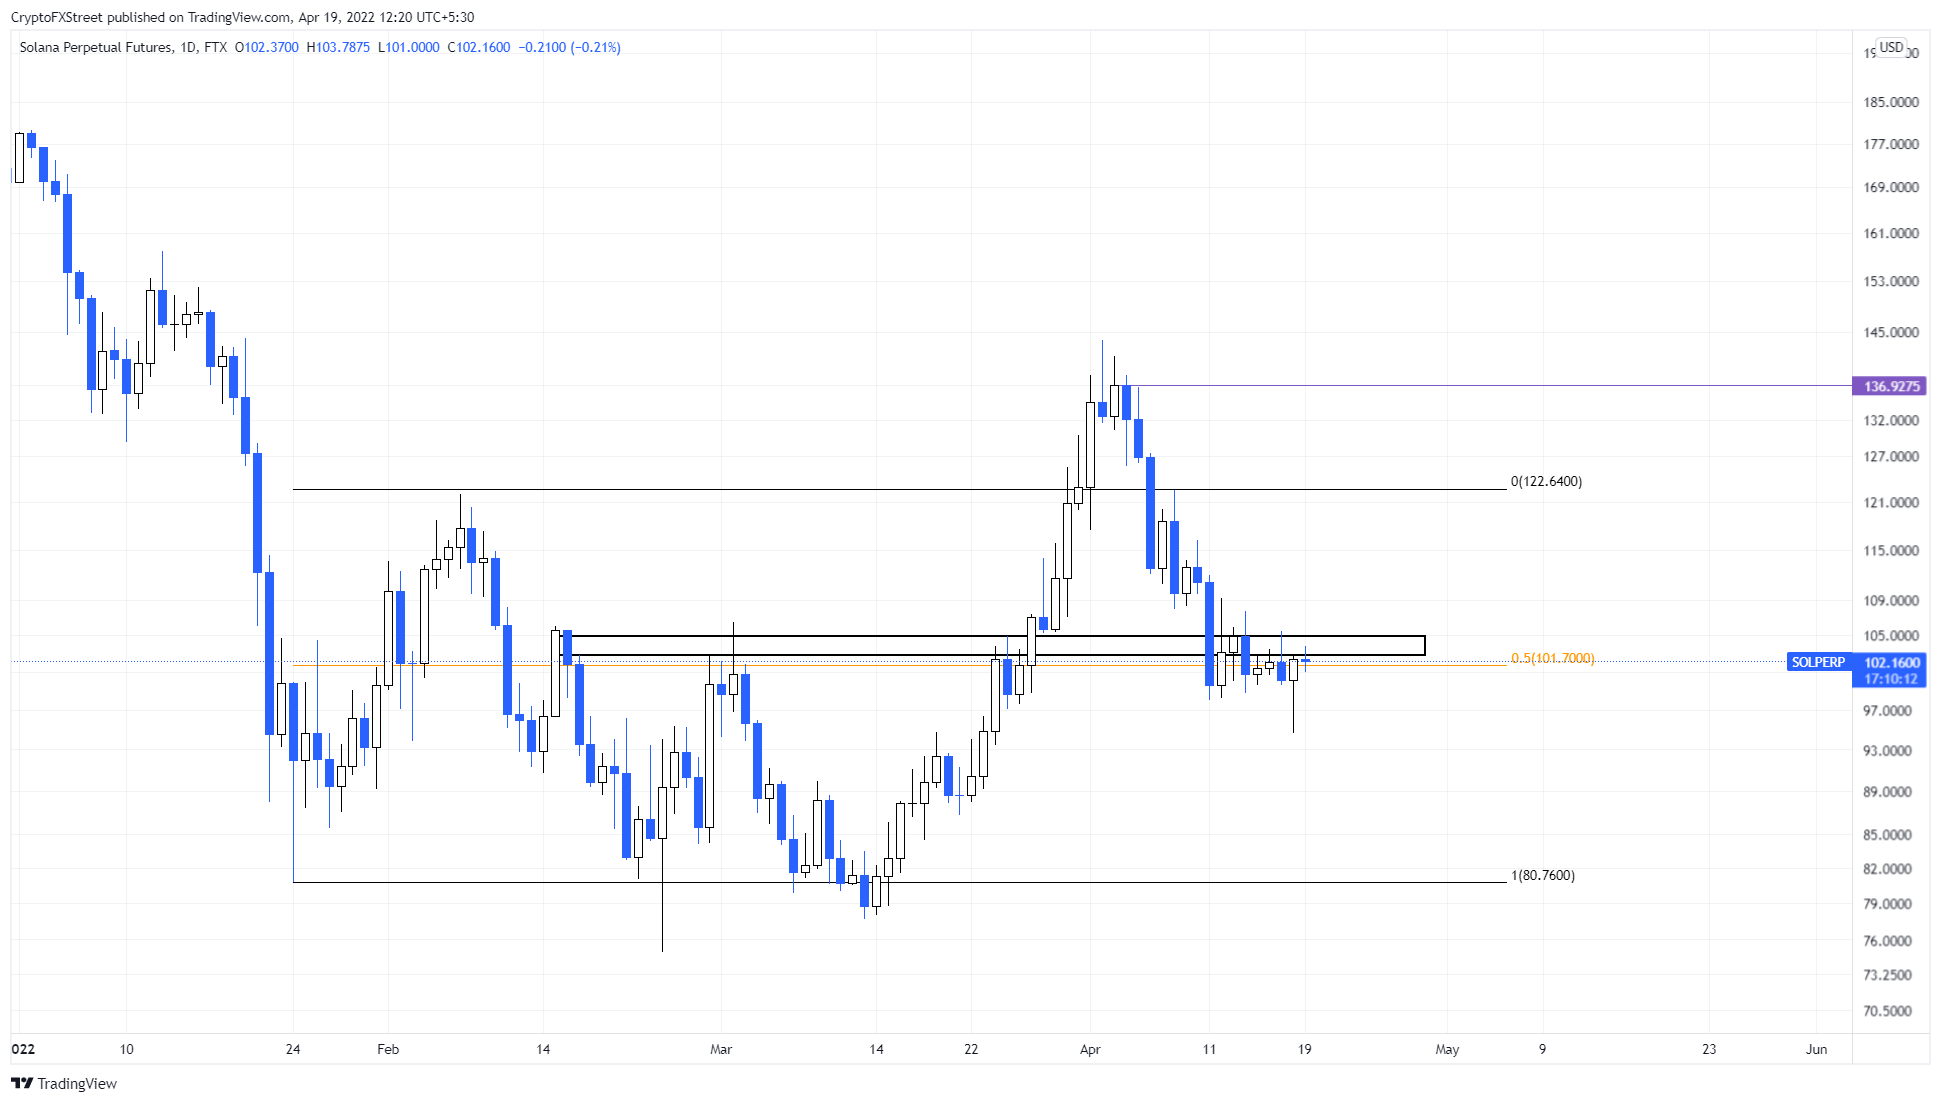
SOL/USDT 1-day chart
While things are looking balanced for SOL, a failure to move above $105.51 will expose bullish momentum as inadequate. In such a case, Solana price could slide lower and revisit the range low at 80.76.
A daily candlestick close below $80.76 will invalidate the bullish thesis and open SOL up for further crashes.
Author

Akash Girimath
FXStreet
Akash Girimath is a Mechanical Engineer interested in the chaos of the financial markets. Trying to make sense of this convoluted yet fascinating space, he switched his engineering job to become a crypto reporter and analyst.




