Shiba Inu price to provide buy opportunity before SHIB doubles again
- Shiba Inu price is due for a retracement after rallying 113% in less than three days.
- The MRI displays a major sell signal, hinting at a correction that could extend 17%.
- A bounce off the $0.0000446 support floor will kick-start another 100% advance to $0.0000914.
Shiba Inu price saw a massive up move after it broke out of its consolidation pattern on October 23. This ascent propelled SHIB to a new all-time high. As bulls overextend the rally, however, things need to cool off before another massive rally emerges. Market participants should anticipate a retracement, therefore.
Shiba Inu price needs to cool down
Shiba Inu price rose 28% on October 27 to set up a new all-time high at $0.0000595. The altcoin markets are seeing a massive sell-off, however, which is reflected in the SHIB price. So far, Shiba Inu price has dropped 10% from the peak, and the Momentum Reversal Indicator has flashed a red ‘one’ sell signal on the 12-hour chart.
This technical formation forecasts that a one-to-four candlestick correction is likely. Investors need to be prepared for correction, therefore, that will serve as a “buy” opportunity. The support barrier at $0.0000446 is the first level to keep an eye out for. While a bullish reaction here is likely, the SHIB could drop down to $0.0000414. As long as the 12-hour candlestick does not close below $0.00000383, the buying opportunity remains valid.
Assuming Shiba Inu price stays above the said barriers, investors can expect the memecoin to make a healthy comeback and restart its upswing.
In this situation, SHIB will likely make a run at its newly erected all-time high at $0.0000595 and then tag the 161.8% trend-based Fibonacci extension level. If the bullish momentum is similar to the one seen after the breakout of the bullish pennant, investors can expect the Dogecoin killer to lock in on the next level at $0.0000914. This ascent would constitute a 104% gain from $0.0000446 and would essentially double the market value of SHIB tokens.
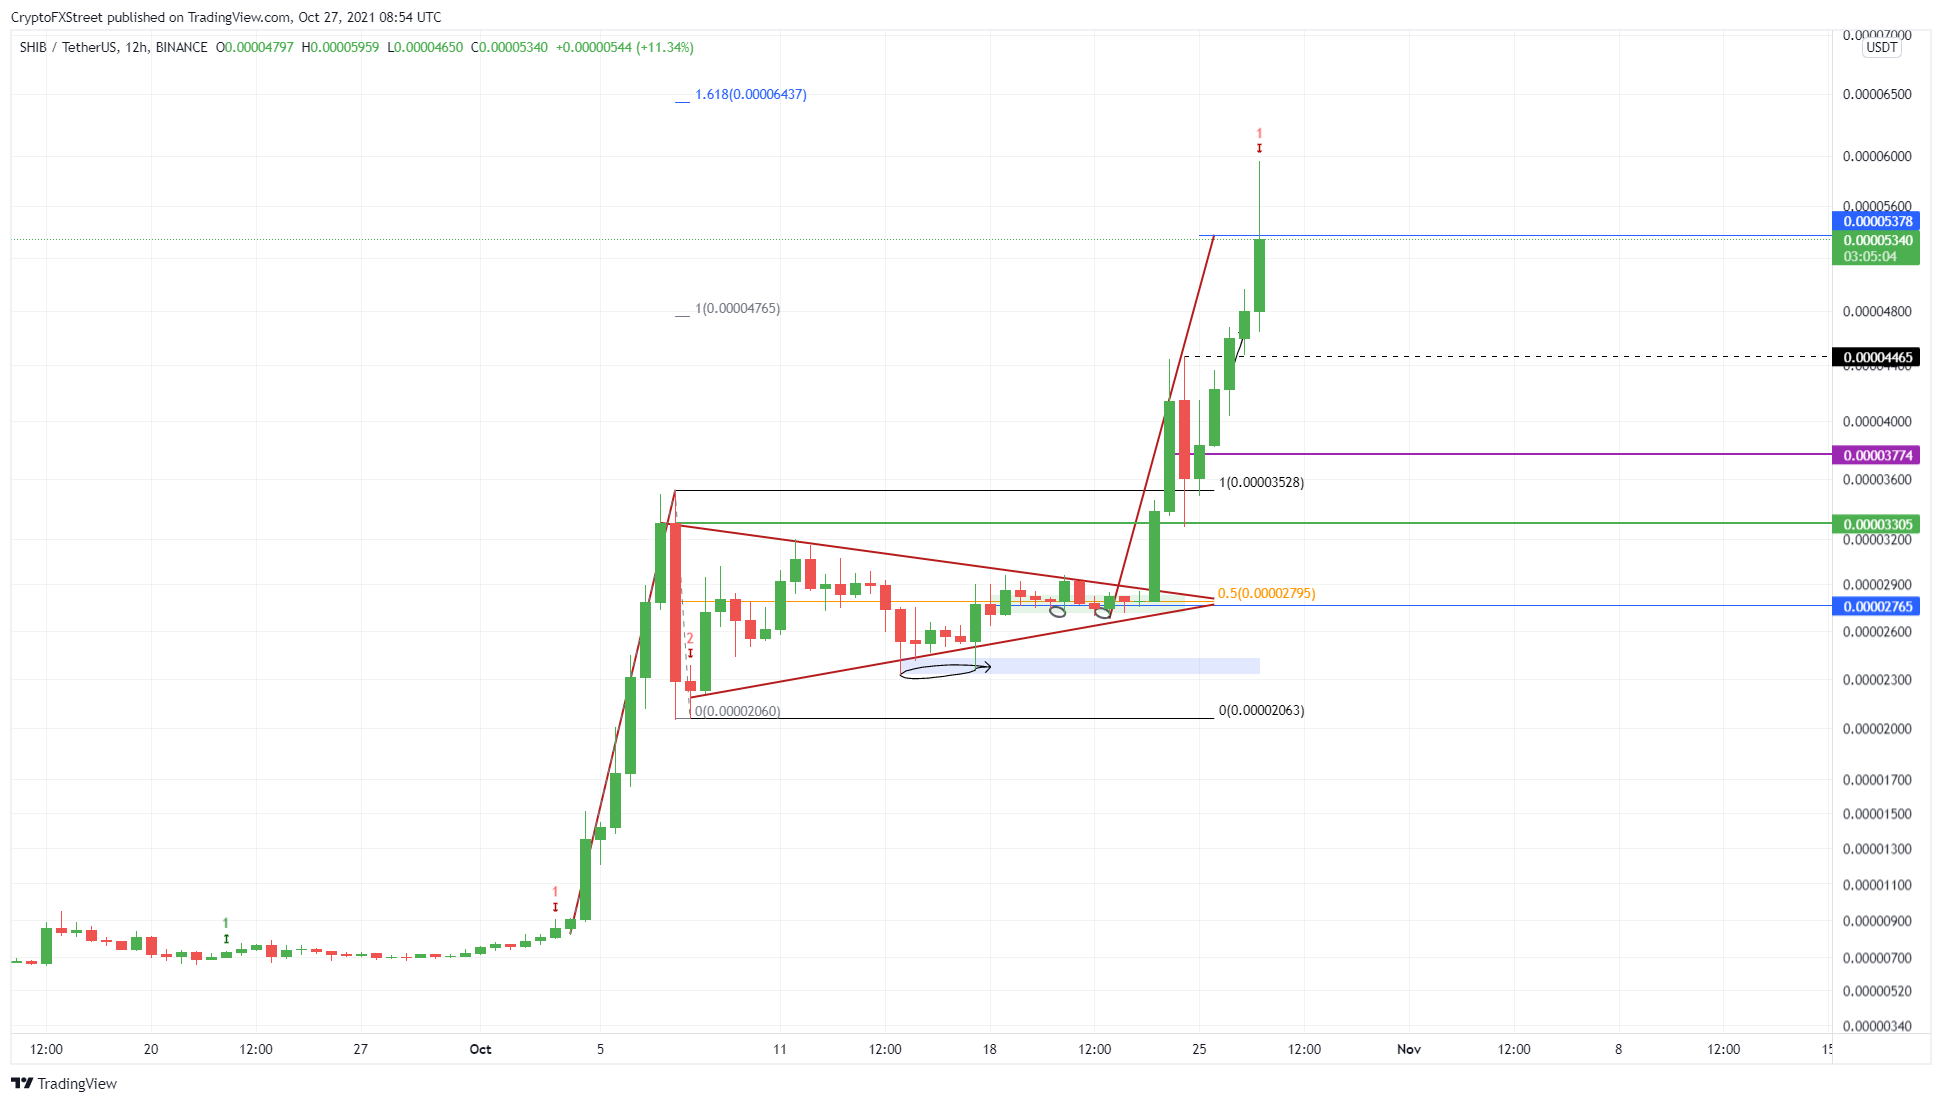
SHIB/USDT 12-hour chart
While a retracement is a boon for long-term holders, short-term holders would not like it if it extended. SHIB needs to stay above $0.0000383, therefore. A decisive 12-hour close below this barrier, however, will suggest that the downswing will extend lower.
In such a situation, investors can expect SHIB to retest the range high at $0.00003528. A breakdown of this barrier, however, will invalidate the bullish thesis.
Author

Akash Girimath
FXStreet
Akash Girimath is a Mechanical Engineer interested in the chaos of the financial markets. Trying to make sense of this convoluted yet fascinating space, he switched his engineering job to become a crypto reporter and analyst.


