- Shiba Inu price ticks up 1% during European trading.
- SHIB price is set to attack the red descending trend line as the US Dollar flirts with new highs.
- Expect a jump but plenty of technical headwinds before the road is cleared to the upside.
Shiba Inu (SHIB) price action is set to continue its bullish path as whales are finally entering the trading action. Tuesday night's explosion in Poland saw SHIB price being unfazed, meaning that traders in their positions are sticking to their guns to see this through. Although the first cap needs to be taken, there are several technical elements to the upside before traders can relax and see a solid continuous rally unfold.
SHIB price could rally substantially if it can overcome these challenges
Shiba Inu price action is seeing momentum swinging in its favor as markets eagerly trade on the weaker US Dollar, which was the omen for most of 2022 in several asset classes. Cryptocurrencies as a group have been enjoying the big drop in the Greenback this week and are booking gains on the back of it. With more cash and big whales mixing into SHIB price action, expect to see a pop higher should the red descending trend line break to the upside under pressure that is building up as we speak.
SHIB price action would still face two additional hurdles on the topside before traders can start sitting on their hands and see a broader stretched rally continue. That first challenge will come from the 55-day Simple Moving Average (SMA) at $0.00001080, which holds importance for most of October. The last one is the 200-day SMA at $0.00001180, which has been chopped up at the beginning of this month and, as it has been weakened, could be taken out should the US Dollar weaken further.
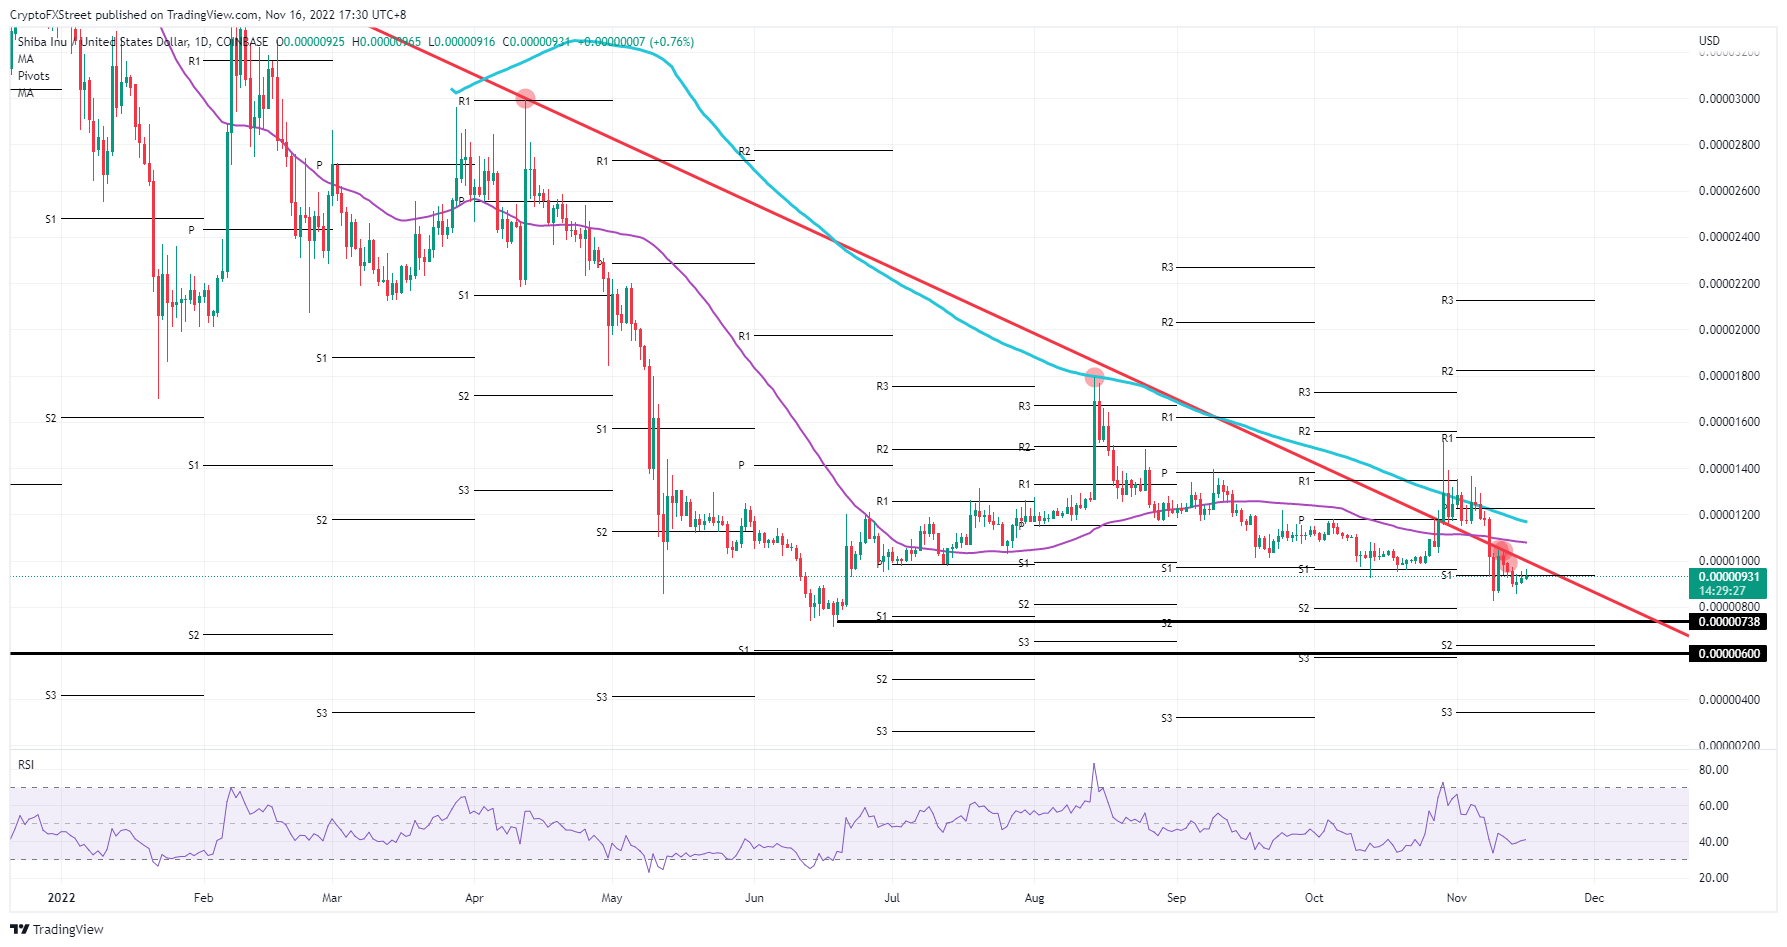
SHIB/USD daily chart
It must be underlined that markets are reacting on the back of lower US inflation and a lower Producer Price Index reading from Tuesday, which triggered the second round of US Dollar weakness. Markets are missing the detail here that both metrics measured October; thus, it is quite normal that they both bore a lower print. It will take more than that before the Fed takes the foot off the gas pedal. When the Fed delivers that message at upcoming events, expect to see SHIB price drop back below $0.00001000 and test $0.00000738 to the downside.
Information on these pages contains forward-looking statements that involve risks and uncertainties. Markets and instruments profiled on this page are for informational purposes only and should not in any way come across as a recommendation to buy or sell in these assets. You should do your own thorough research before making any investment decisions. FXStreet does not in any way guarantee that this information is free from mistakes, errors, or material misstatements. It also does not guarantee that this information is of a timely nature. Investing in Open Markets involves a great deal of risk, including the loss of all or a portion of your investment, as well as emotional distress. All risks, losses and costs associated with investing, including total loss of principal, are your responsibility. The views and opinions expressed in this article are those of the authors and do not necessarily reflect the official policy or position of FXStreet nor its advertisers. The author will not be held responsible for information that is found at the end of links posted on this page.
If not otherwise explicitly mentioned in the body of the article, at the time of writing, the author has no position in any stock mentioned in this article and no business relationship with any company mentioned. The author has not received compensation for writing this article, other than from FXStreet.
FXStreet and the author do not provide personalized recommendations. The author makes no representations as to the accuracy, completeness, or suitability of this information. FXStreet and the author will not be liable for any errors, omissions or any losses, injuries or damages arising from this information and its display or use. Errors and omissions excepted.
The author and FXStreet are not registered investment advisors and nothing in this article is intended to be investment advice.
Recommended Content
Editors’ Picks
Ripple's move above this key level could trigger nearly 50% rally for XRP
Ripple has overcome a critical resistance level and flipped into a support floor on the weekly time frame. This development happened while XRP tightly consolidated for roughly 250 days. Investors can expect XRP to kickstart a massive rally.
Optimism price outlook with nearly $90 million worth of OP tokens flooding markets on Friday
Optimism volatility has shrunk in the ours leading to the network’s cliff unlock. It joins the likes of dYdX and Sui, which have similar events on their calendars. As token unlocks are often considered bearish catalysts, investors should brace for a reaction after the event.
Top 3 Price Prediction Bitcoin, Ethereum, Ripple: Retail watches from the sidelines with a bias for shorts
Bitcoin could clear $73,777 peak as BTC bulls resurface. Ethereum might fall 10% before next leg up as ETH RSI teases with sell signal. XRP could lose $0.6000 threshold as Ripple bulls fail to show up.
Jito price could hit $6 as JTO coils up inside this bullish pattern
Jito price action shows a potential cup and handle formation. Based on theoretical measurement rules, a successful breakout could yield a 56% rally to $6.0. A breakdown of the $3.86 support level would create a lower low for JTO and invalidate the bullish thesis.
Bitcoin: BTC may have recovered, but is it out of the woods?
Bitcoin’s (BTC) upward momentum has shown a significant decline for the past two weeks or so. This development led to a bearish signal on the weekly and an uncertain outlook on the monthly.